[ad_1]
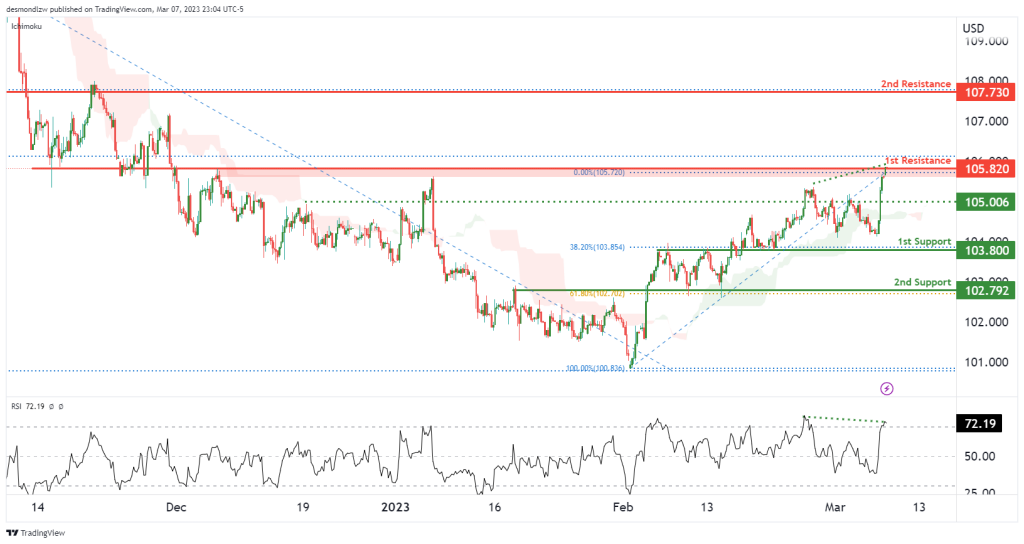
Price is at the 1st resistance area of 105.82, which is an overlap resistance. If the price were to reverse from this level, it could potentially drop to our 1st support at 103.80, which has the 38.2% Fibonacci retracement. The next support level is at 102.79, which is an overlap support that lines up with the 61.8% Fibonacci retracement.
In terms of resistance, if the price were to break the 1st resistance, it could push up to 107.730, which is an overlap resistance. Please note that there might be a bearish divergence in H4.

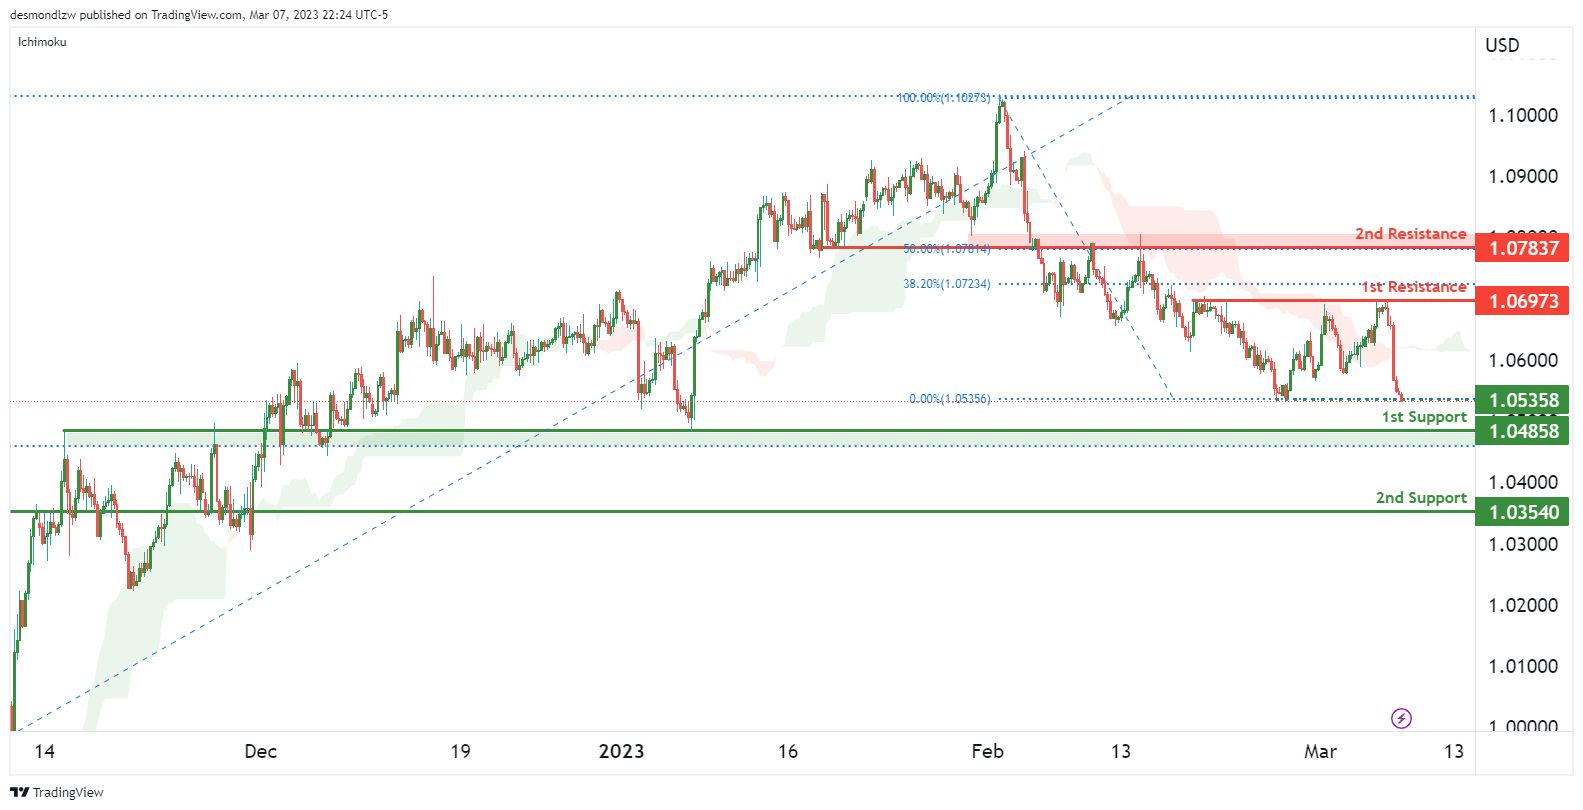
Price has reversed from a major resistance at 1.0697, which is a multiple swing high resistance. The price could come down to the 1st support at 1.0485, which is the recent swing low support. Currently, the price is at the intermediate support level of 1.0535.
If the price breaks the 1st resistance, it could rise to the 2nd resistance at 1.0783, which is a key overlap resistance that lines up with the 50% Fibonacci retracement.
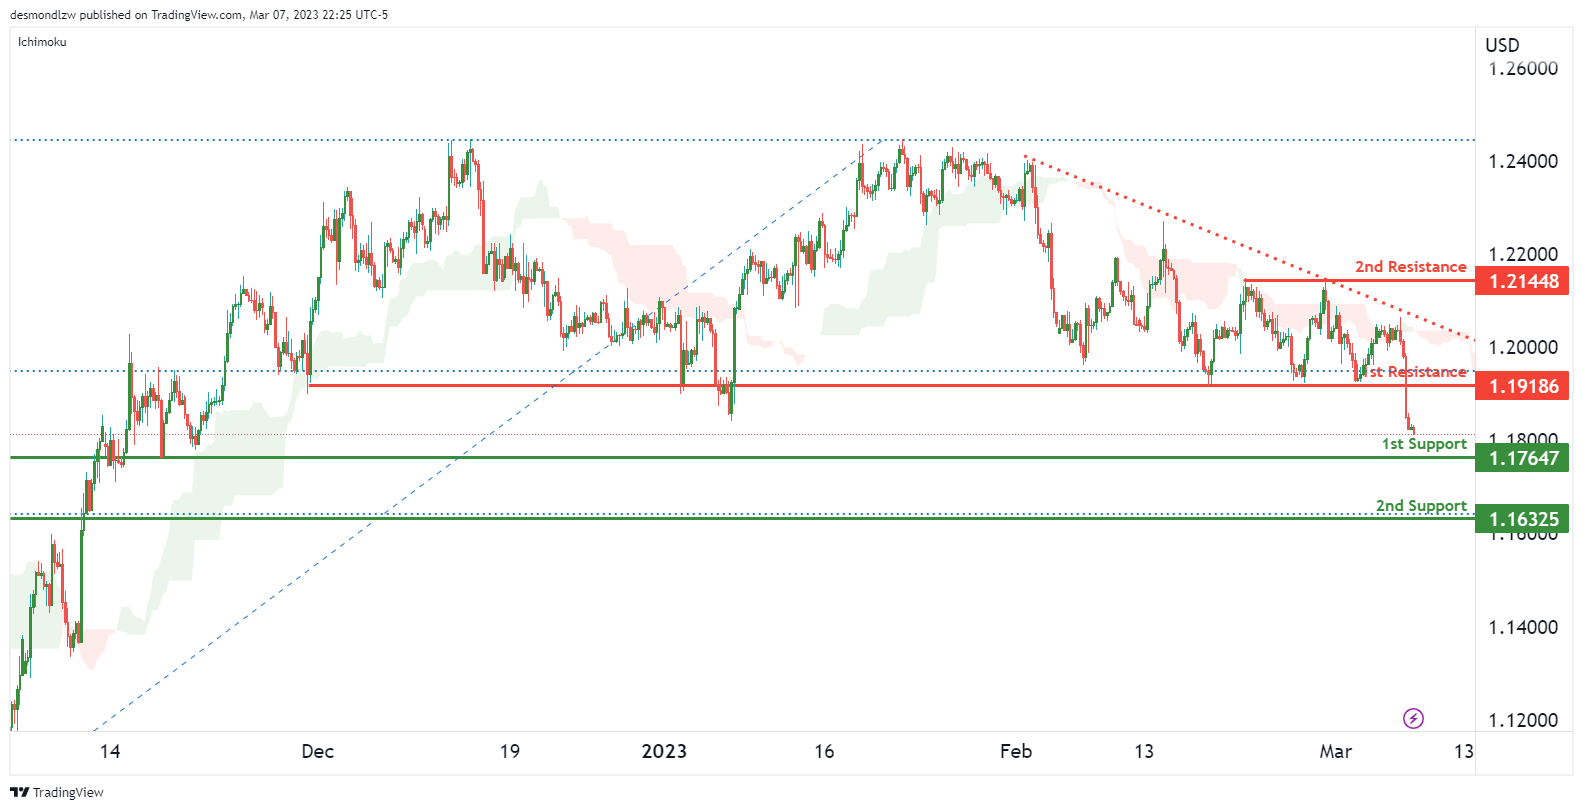
Price is respecting a descending resistance line, pushing prices down towards our 1st support at 1.1764, which is an overlap support. It’s worth noting that the price is also experiencing bearish momentum from the Ichimoku cloud, which could add to the conviction we have that the price will be pushed lower.
Regarding resistance levels, our 1st resistance is at 1.1918, which is an overlap resistance, and the 2nd resistance level is at 1.2144.
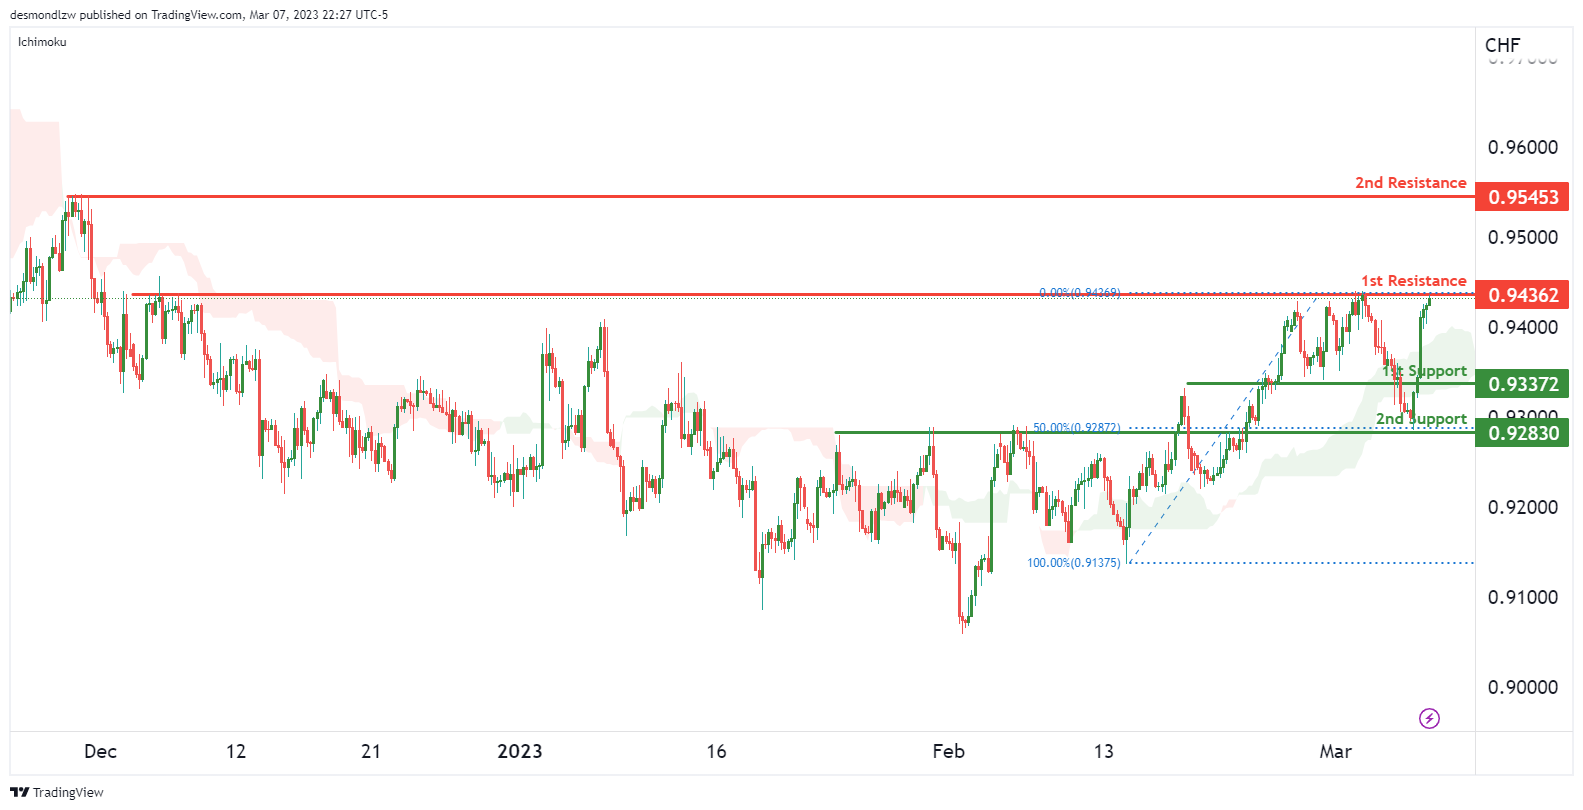
Price is currently at the 1st resistance level of 0.9436, which is strong resistance, as we have seen multiple touches on this level in the past. If the price were to break from this level, it could push up to the 2nd resistance at 0.9545.
Regarding support levels, if the price were to reverse from the 1st resistance, we could see it drop to the 1st support at 0.9337. The 2nd support level is at 0.9283, which lines up with the 50% Fibonacci retracement.
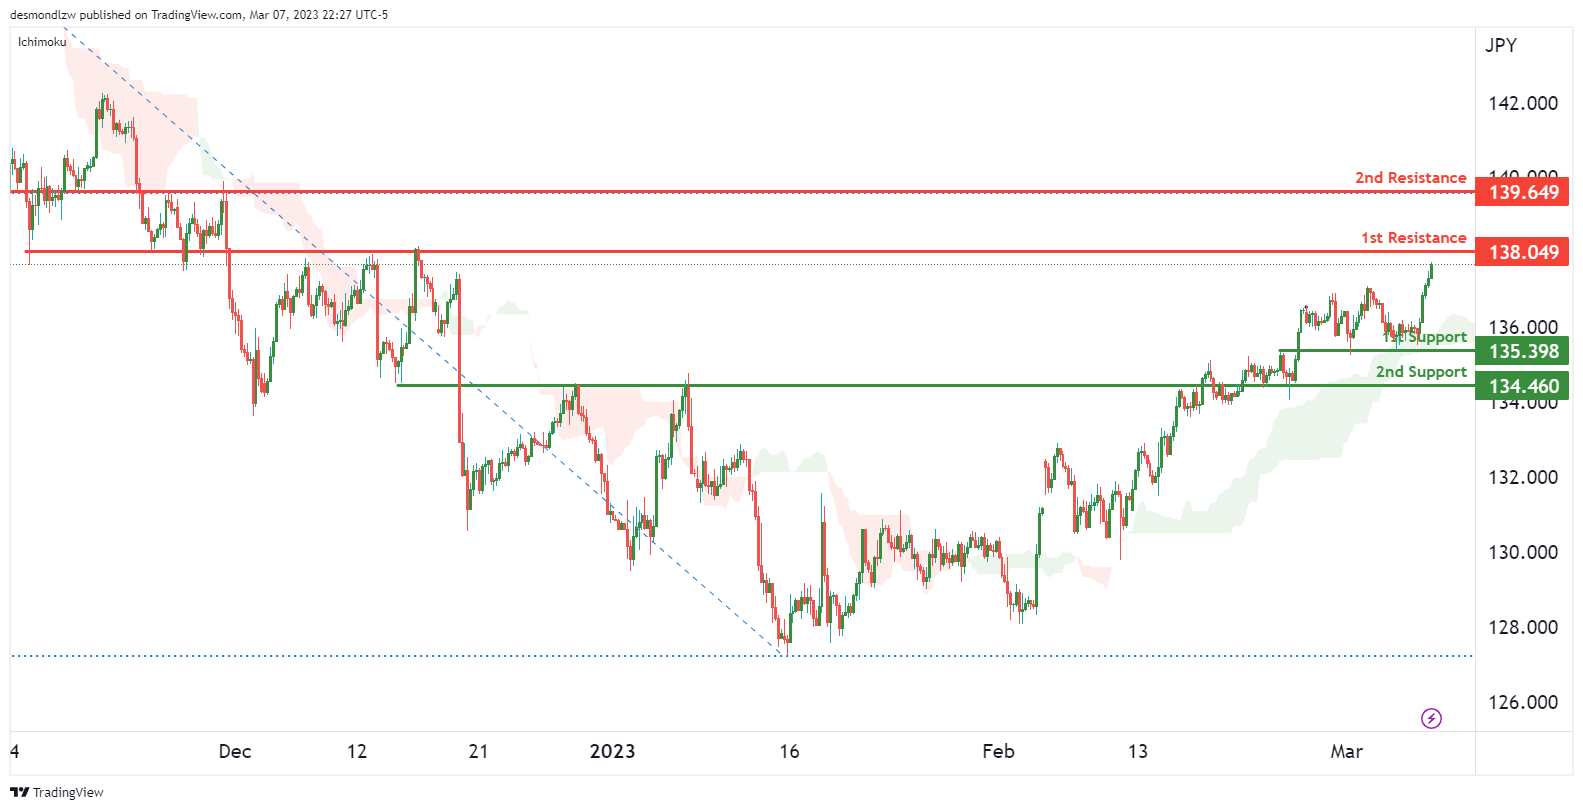
The price has reversed from our 1st support level at 135.39, and it is now approaching the 1st resistance level at 138.04, which is an overlap resistance. If the price were to break from this level, it could push up to our 2nd resistance level at 139.64.
Regarding support levels, the next support level is at 134.46, which is a strong overlap support.
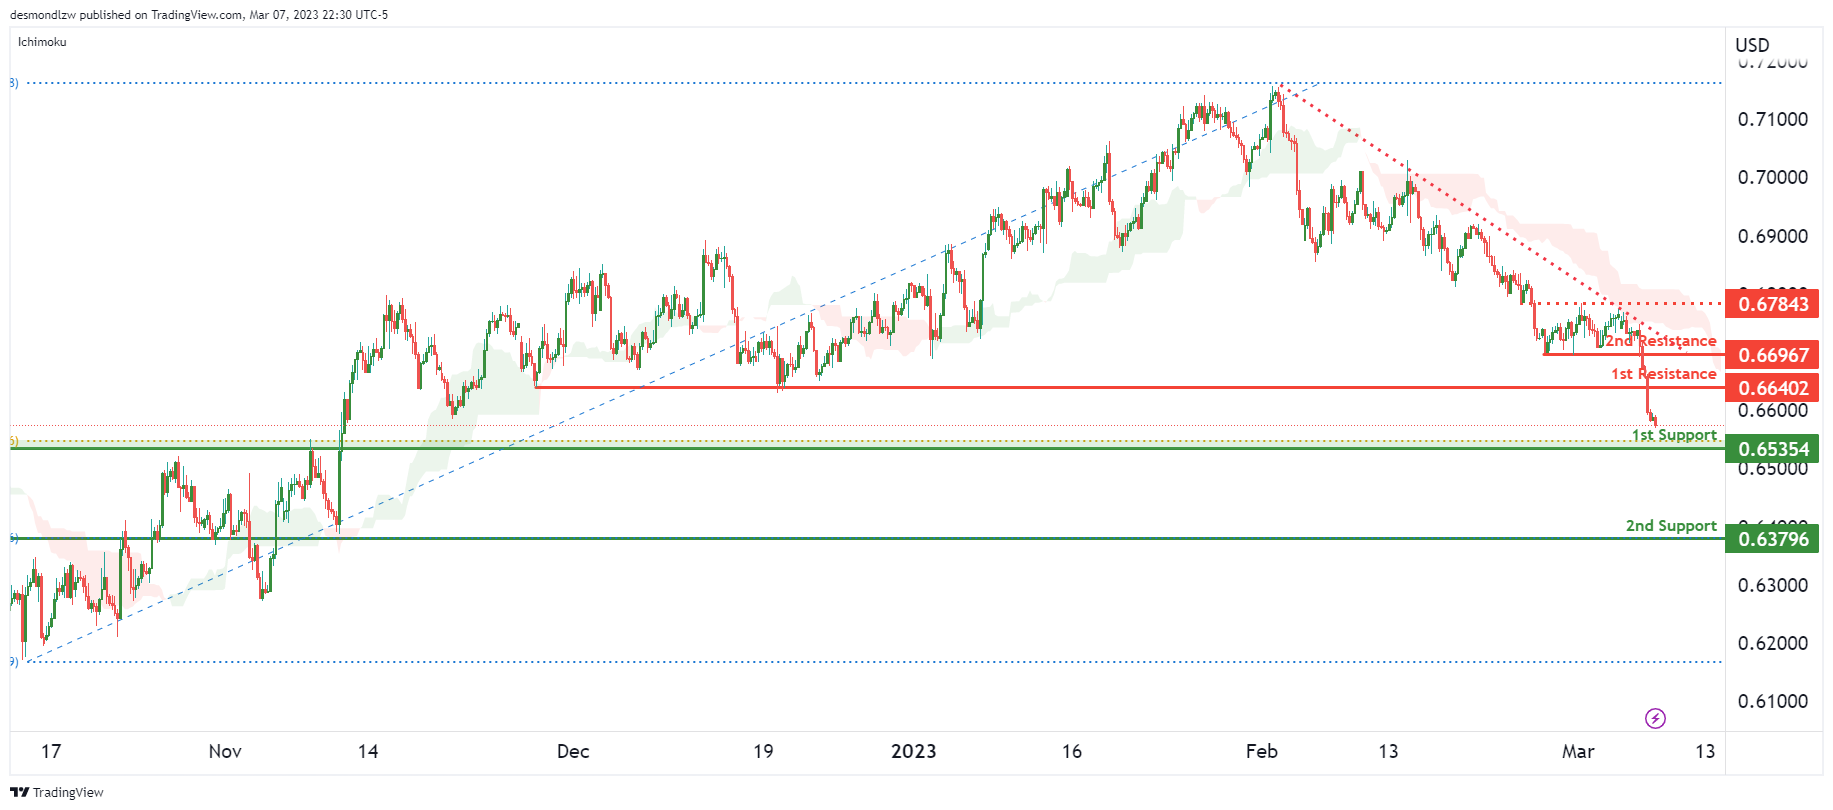
The price is experiencing strong bearish momentum from a long-term descending resistance line. Along with that, we can see the bearish Ichimoku cloud pushing prices further down. The 1st support that needs to be broken is at 0.6535, which is an overlap support. If the price were to break from this level, the next key support level would be at 0.6379, which is another overlap support.
Regarding resistance levels, the 1st resistance is at 0.6640, and the 2nd resistance is at 0.6696.
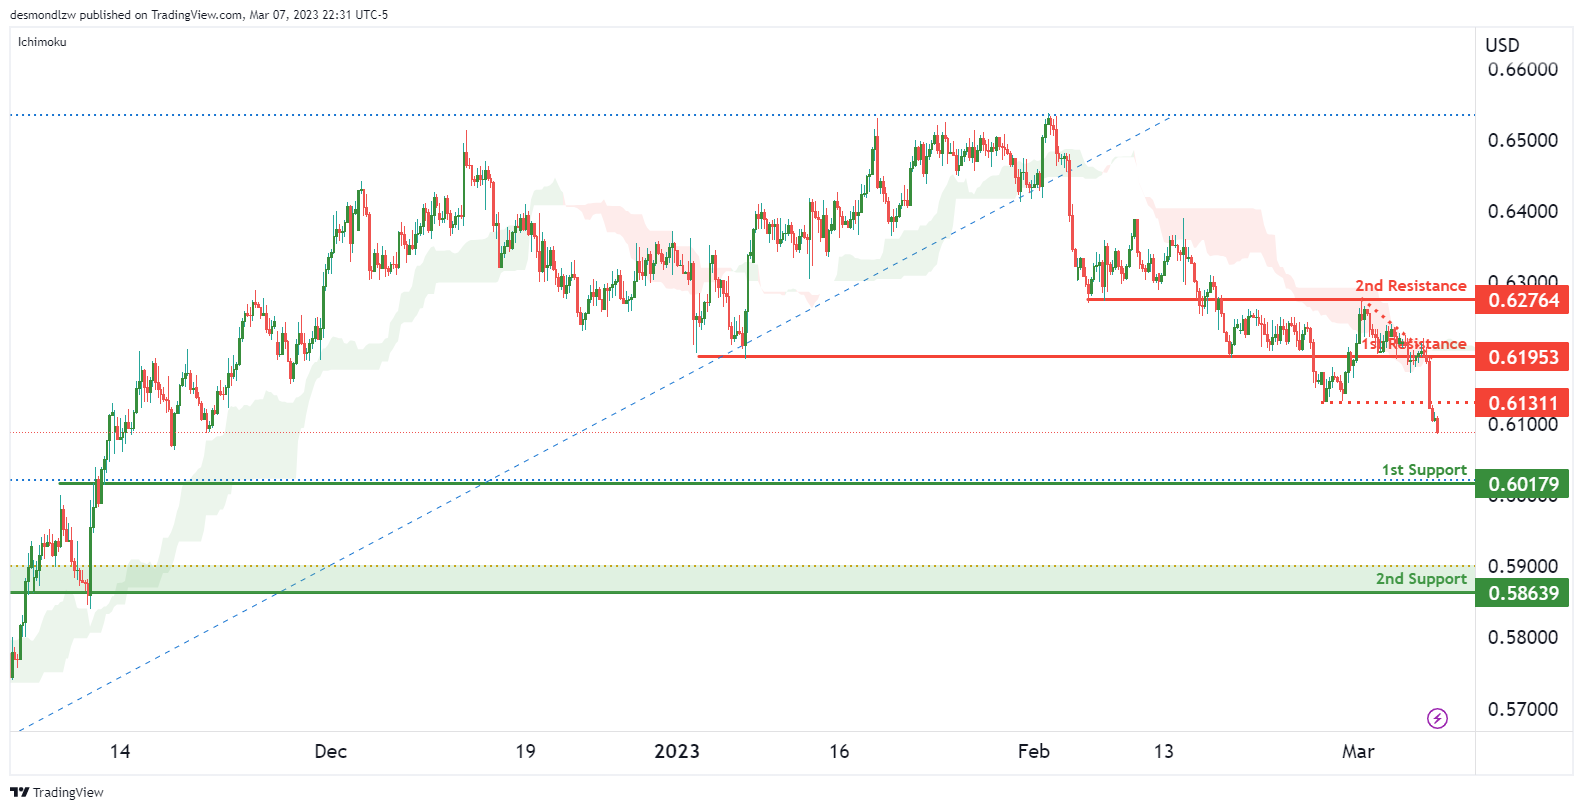
We are currently seeing a strong bearish momentum in the price, and the bearish Ichimoku cloud is pushing prices further down. The price could come down to the 1st support level at 0.6017, and if the price were to break from that level, it could drop down to the 2nd support level at 0.5863, which is another overlap support.
Regarding resistance levels, the 1st resistance is at 0.6131, which is an overlap resistance, and the 2nd resistance is at 0.6276.
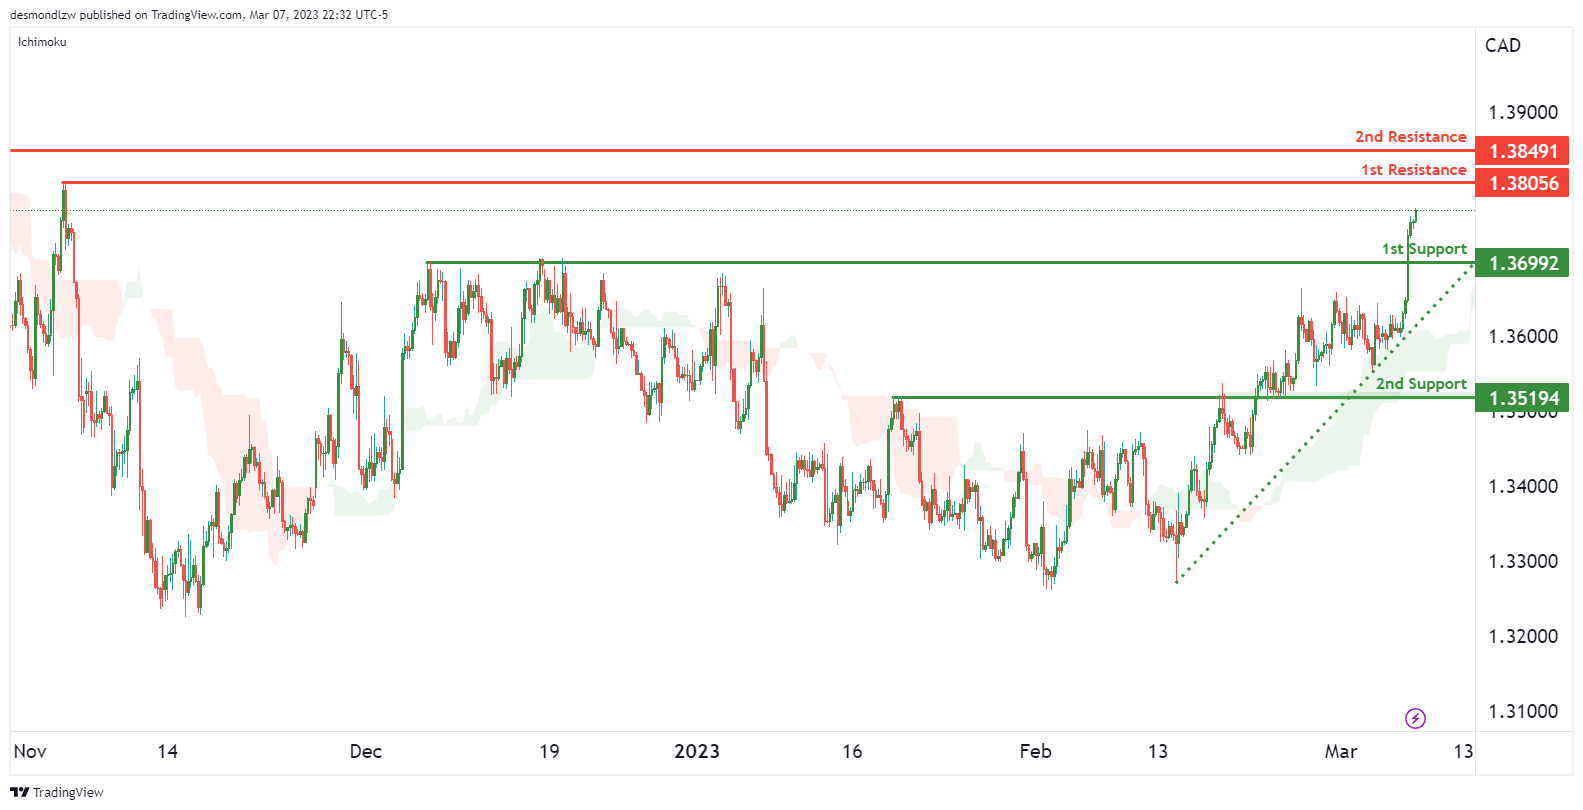
The price is approaching the 1st resistance level at 1.3805, which is the recent swing high. If the price were to break from this level, it could push up to the 2nd resistance level at 1.3849.
Regarding support levels, the 1st support level is at 1.3699, and the 2nd support level is at 1.3519, which is an overlap support.
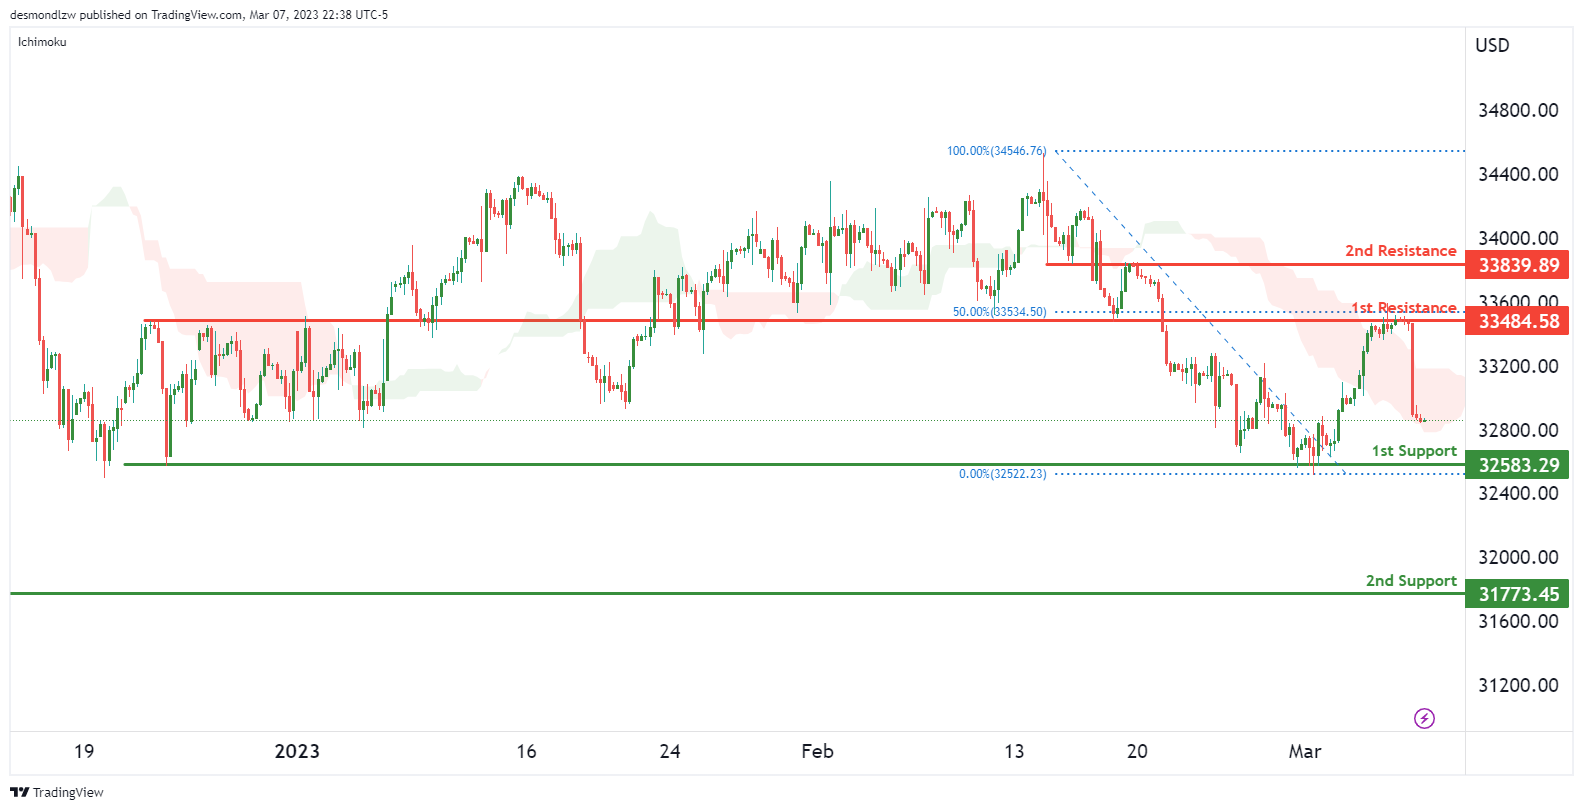
The price has reversed from the 1st resistance level at 33484, and it is currently dropping towards the 1st support level at 32583. If the price were to break this level, the next support level is at 32083, which the price has multiple touches in the past.
Regarding resistance levels, if the price were to break from the 1st resistance level, the next resistance level is at 33839, which is an overlap resistance.
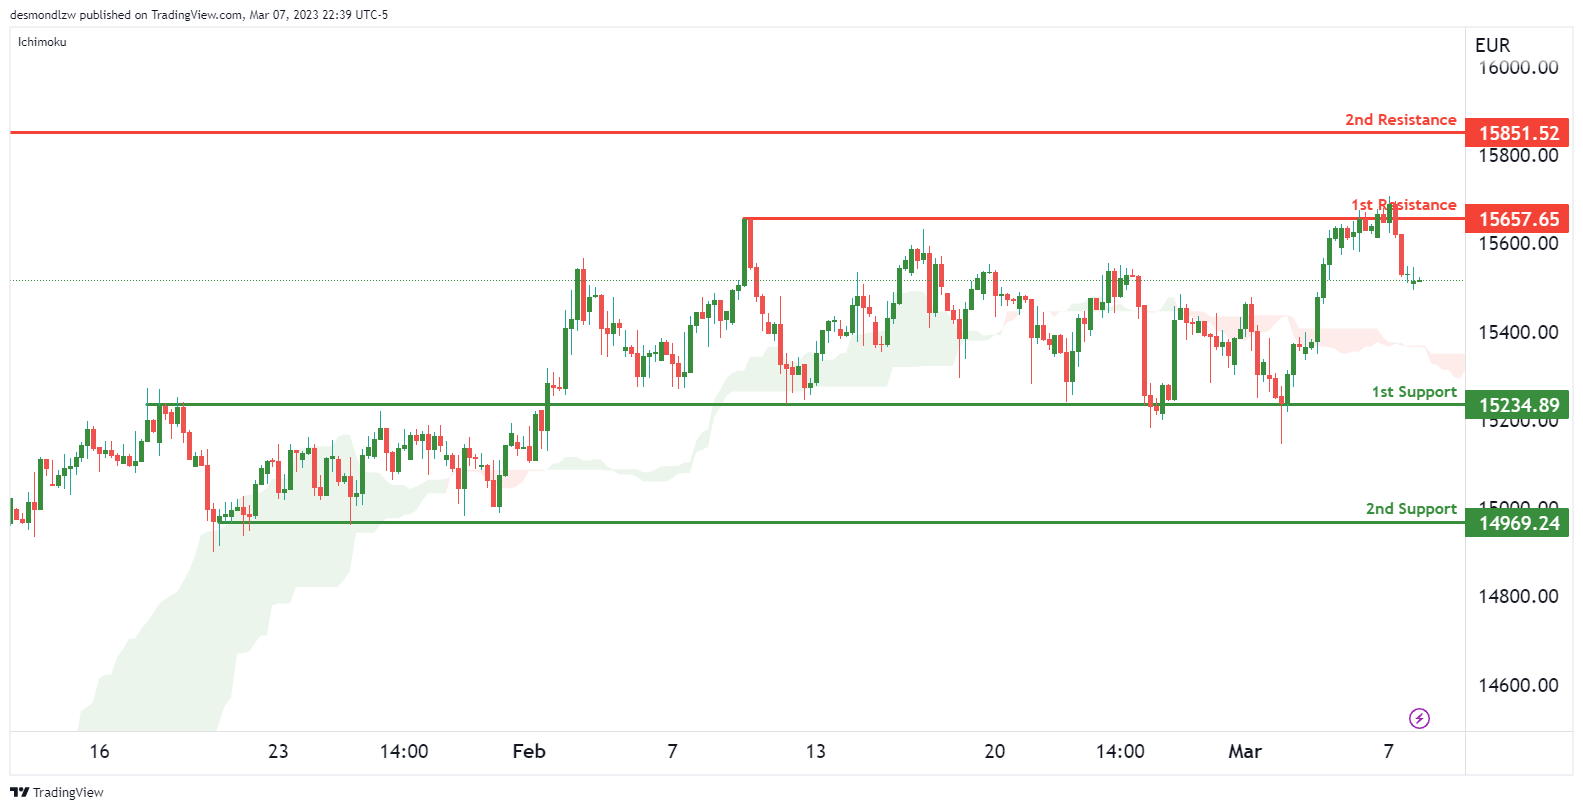
The price has reversed from the major swing high resistance level at 15657, and the 2nd resistance level is at 15851. We could see the price drop to the 1st support level at 15234, and the 2nd support level is at 14969, which is another overlap support.
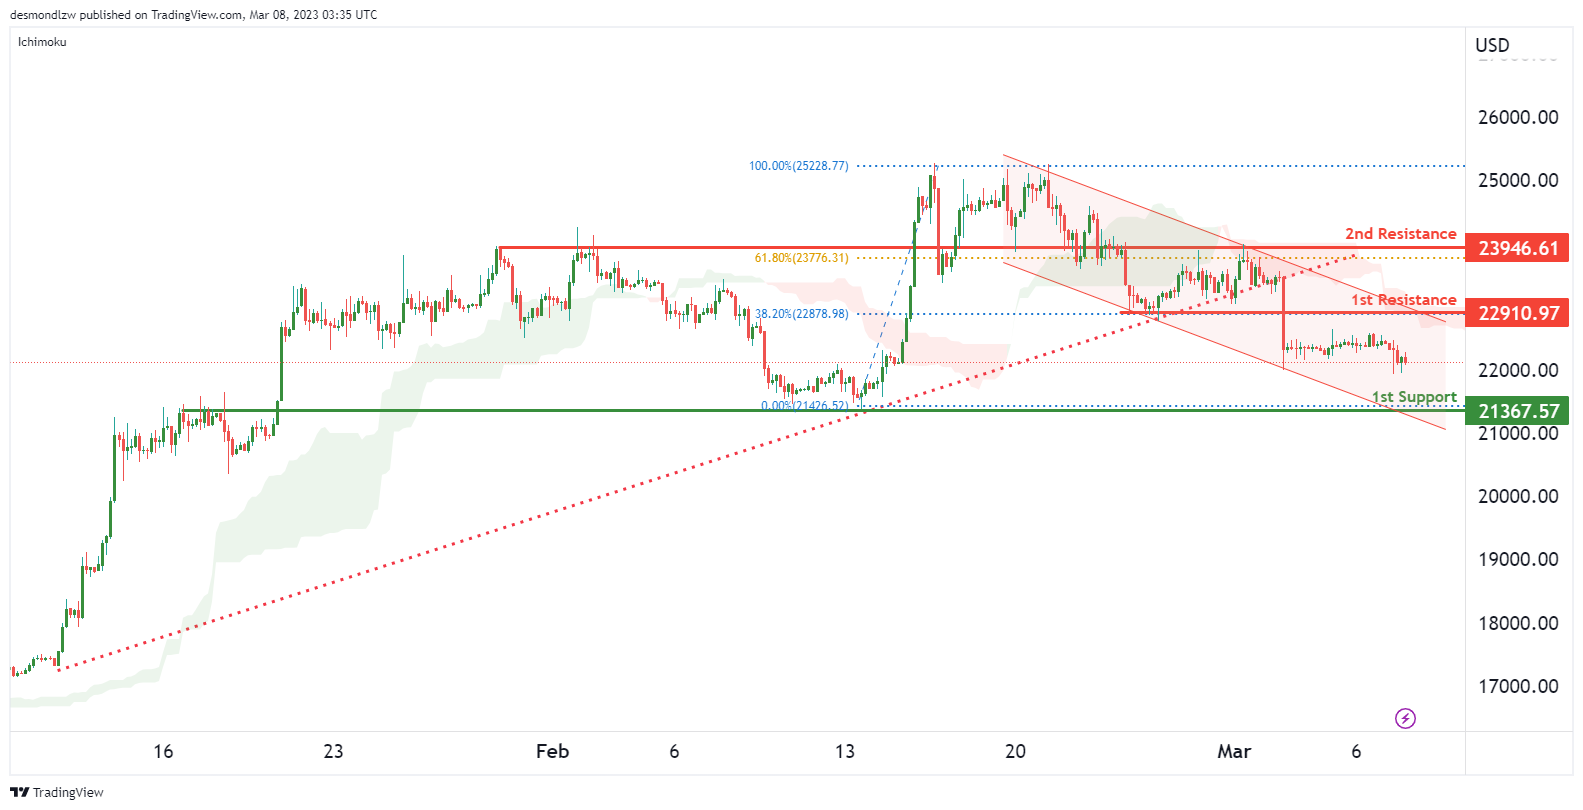
Price is in a descending channel and seeing our 1st resistance at 22910 which is a Fibonacci retracement and a pullback resistance. If price reverses from this level, we could see the bearish momentum take prices lower to 21367 which is an overlap support.
It’s worth noting that price has finally broken a long term ascending support-turned-resistance line which suggests that we might be seeing a longer term shift to bearish momentum.
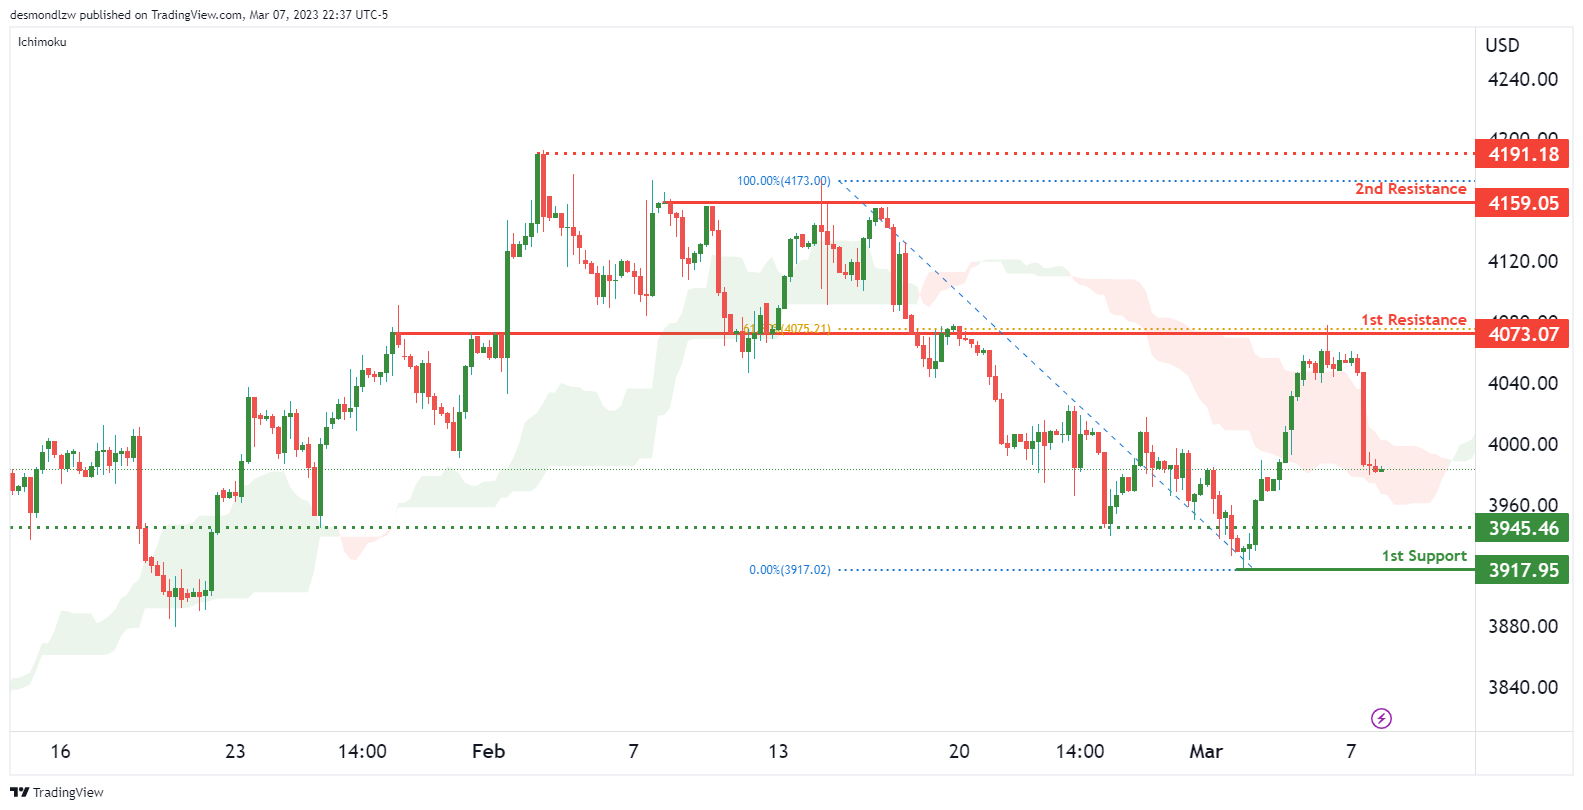
The price has reversed from a major overlap resistance at 4073, which also lines up with the 61.8% Fibonacci retracement. We could see it drop to the 1st support level at 3917, which is the recent swing low. Please take note of the intermediate support level at 3945.
If the price were to break from the 1st resistance level, the next resistance level is at 4159.
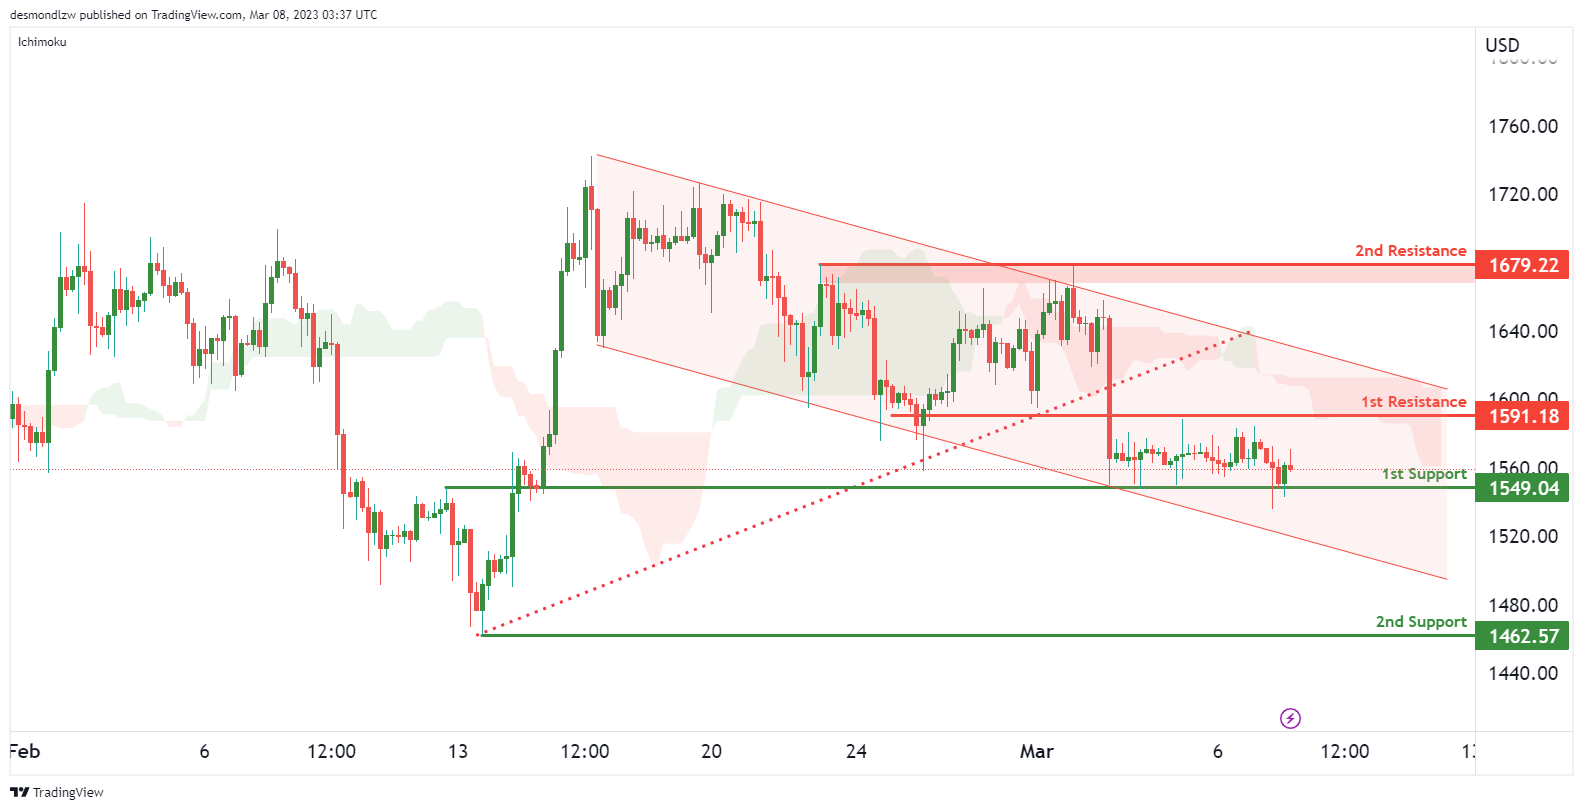
Price is in a bearish descending channel with our 1st resistance at 1591 and the 1st support really near at 1549. Price is currently being squeezed between these 2 levels and a break of either should either see prices with recent multi-swing high resistance at 1679 or recent swing low support at 1462.
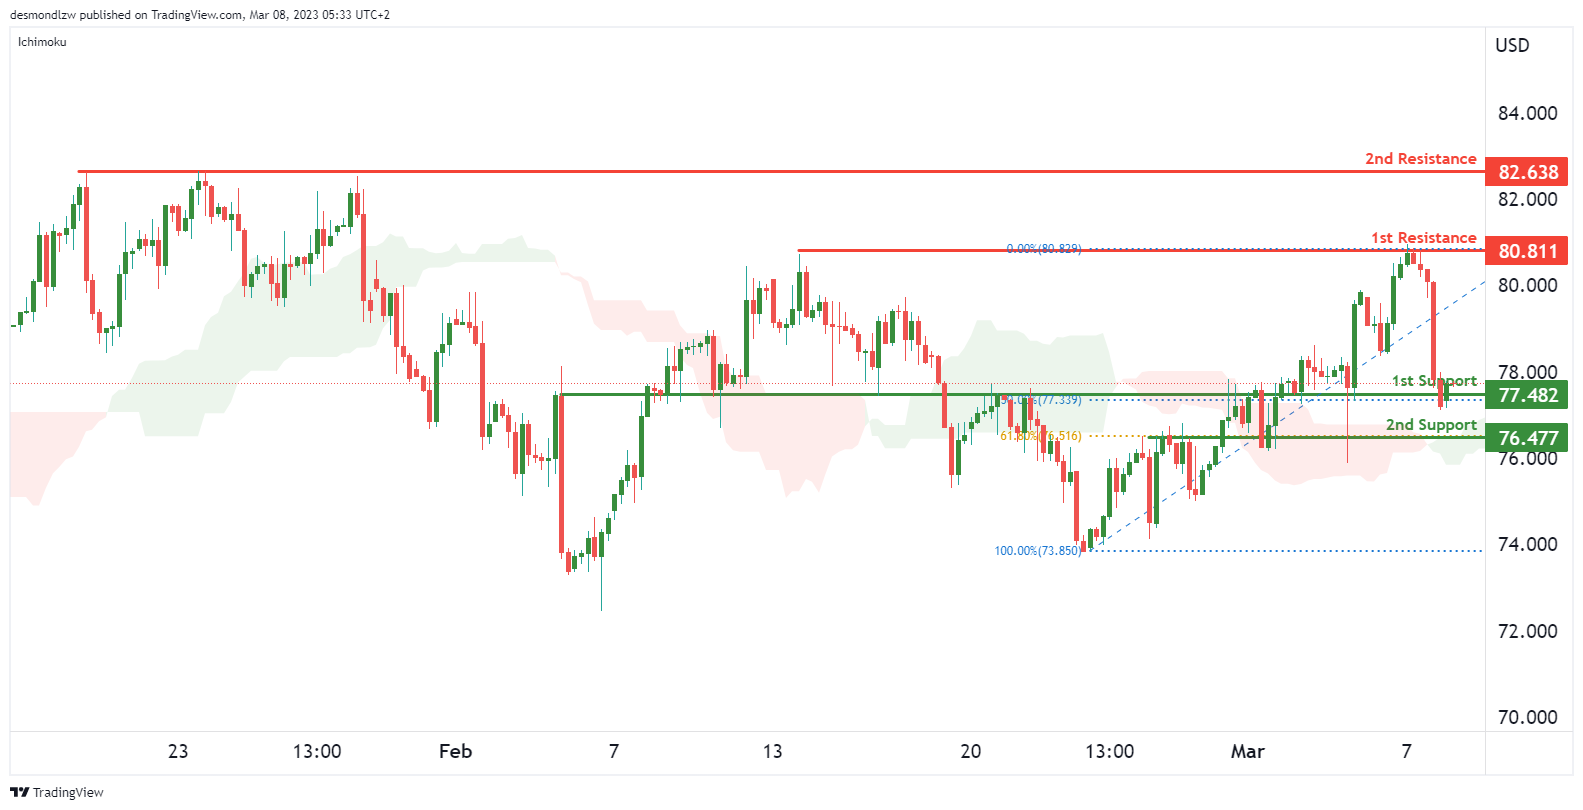
The price is currently in the 1st support area at 77.48, which has the 50% Fibonacci retracement. If the price were to reverse from this level, it could push up to the 1st resistance level at 80.81, which is the recent swing high. However, if the price were to break from this level, the 2nd resistance level would be at 82.63.
Regarding support levels, the support level is at 76.47, which lines up with the 61.8% Fibonacci retracement.
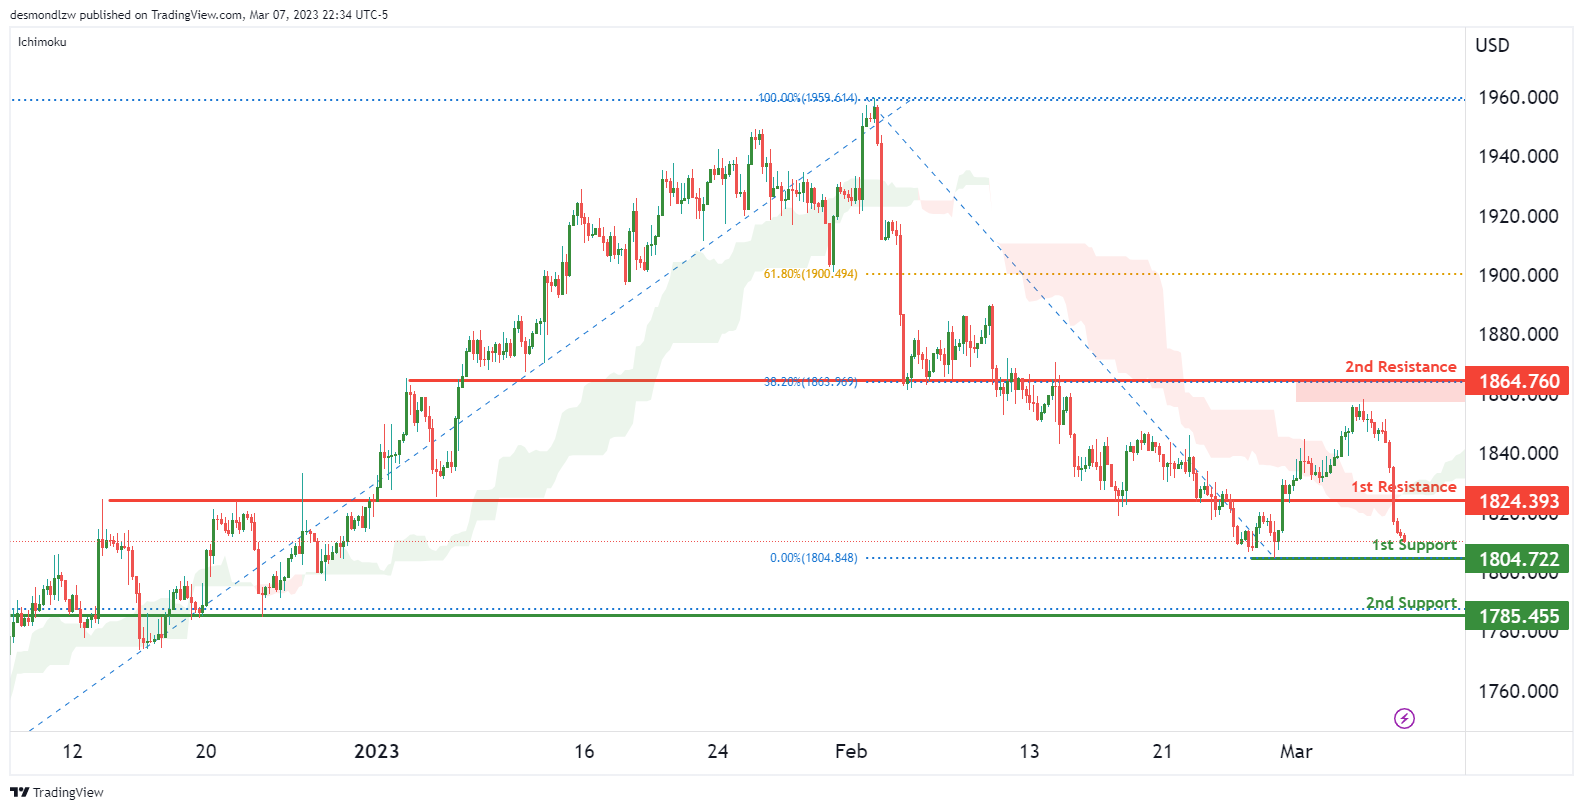
The price is approaching our 1st support level at 1804, which is an overlap support. If the price were to break from this level, we could see it drop back down to the 2nd support level at 1785, which is a major overlap support.
Regarding resistance levels, our 1st resistance level is at 1824, which is an overlap resistance, and the 2nd resistance level is at 1864, which is an overlap resistance that lines up with the 38.2% Fibonacci retracement.
The accuracy, completeness and timeliness of the information contained on this site cannot be guaranteed. IC Markets does not warranty, guarantee or make any representations, or assume any liability regarding financial results based on the use of the information in the site.
News, views, opinions, recommendations and other information obtained from sources outside of www.icmarkets.com, used in this site are believed to be reliable, but we cannot guarantee their accuracy or completeness. All such information is subject to change at any time without notice. IC Markets assumes no responsibility for the content of any linked site.
The fact that such links may exist does not indicate approval or endorsement of any material contained on any linked site. IC Markets is not liable for any harm caused by the transmission, through accessing the services or information on this site, of a computer virus, or other computer code or programming device that might be used to access, delete, damage, disable, disrupt or otherwise impede in any manner, the operation of the site or of any user’s software, hardware, data or property.
[ad_2]
Source link