[ad_1]
- Gold price managed to shake off the bearish pressure following Monday’s slide.
- The technical outlook suggests a bullish bias remains intact.
- US CPI data and Federal Reserve’s policy announcements will dominate the market action next week.
Gold price started the week under bearish pressure and lost more than 1.5% on Monday before regaining its traction. XAU/USD extended its rebound toward $1,800 in the second half of the week but ended up closing the week virtually unchanged. Inflation data from the US and the Federal Reserve’s policy announcements next week will help investors decide whether Gold price will be able to extend its bullish rally into the end of the year.
What happened last week?
Although several cities in China decided to ease coronavirus curbs over the weekend, markets turned risk-averse after the data from China showed that the business activity in the service sector continued to contract at an accelerating pace in November. In turn, the US Dollar gathered strength as a safe haven and forced XAU/USD to stay on the back foot at the beginning of the week.
On Tuesday, the data from the US showed that the ISM Services PMI improved to 56.5 in November from 54.4 in October, helping the US Dollar preserve its bullish momentum, making it difficult for Gold price to stage a rebound.
China, Gold’s premier importer, announced additional easing measures mid-week and Gold price started to retrace its decline on renewed optimism about an improving demand outlook for the precious metal. The Chinese government said asymptomatic positive cases or cases with wild symptoms will be allowed to quarantine at home for seven days. “Any form of mobility control should not be implemented,” the National Health Commission further noted in a statement and explained that mass PCR testing will be largely abandoned and be restricted to hospitals, nursing homes and schools.
In the absence of high-impact data releases, risk flows continued to dominate the financial markets on Thursday and XAU/USD benefited from the selling pressure surrounding the US Dollar.
On Friday, the data from the US showed that the Producer Price Index (PPI) declined to 7.4% on a yearly basis in November from 8.1% in October as expected. The Core PPI declined to 6.2% in the same period, surpassing analysts’ estimate of 6%. With the initial reaction, the US Dollar gathered strength against its rivals but XAU/USD didn’t have a difficult holding its ground ahead of the weekend.
Next week
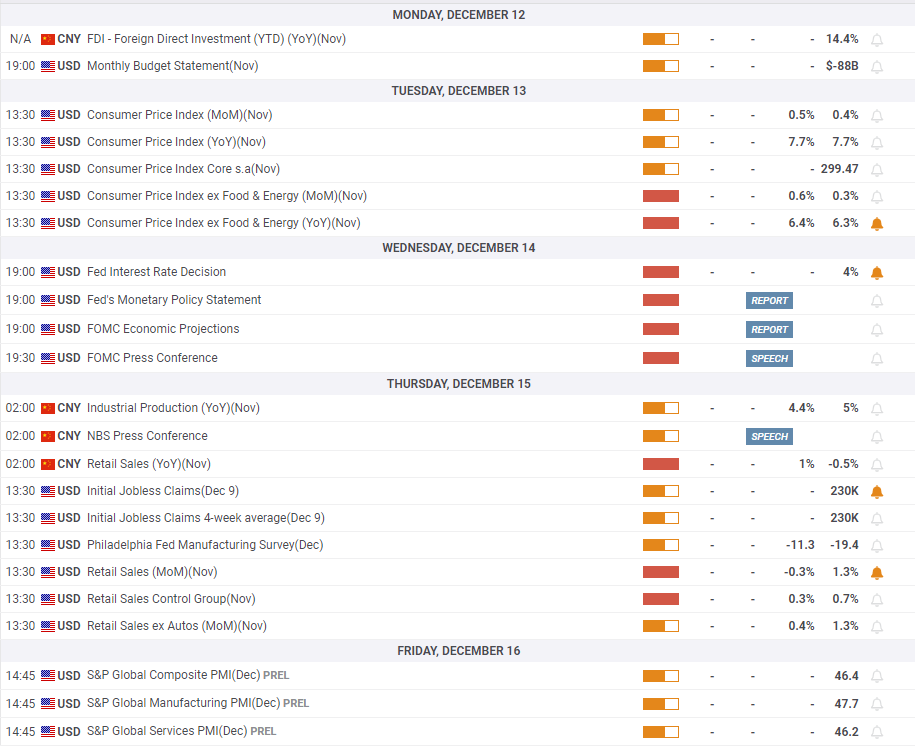
The US Bureau of Labor Statistics will release November inflation data on Tuesday. On a yearly basis, the Consumer Price Index (CPI) is forecast to stay unchanged at 7.7%. The annual Core CPI, which excludes volatile food and energy prices, is expected to edge higher to 6.4% from 6.3% in October. The market reaction to the inflation report is likely to be straightforward with a lower-than-expected Core CPI reading weighing on the US Dollar and providing a boost to XAU/USD and vice versa. Ahead of the Federal Reserve’s policy announcement on Wednesday, however, investors could refrain from making large bets and the impact of CPI data on Gold price could remain short-lived.
According to the CME Group FedWatch Tool, markets are pricing in a high 80% probability of a 50 basis points (bps) rate hike following the December policy meeting. Considering that FOMC Chairman Jerome Powell acknowledged in his last public appearance that it would make sense to moderate the pace of interest rate hikes, a 50 bps increase should not come as a big surprise. In case the Fed opts for a 75 bps hike, which is an extremely low possibility at this point, XAU/USD is likely to come under heavy bearish pressure and fall sharply.
If the Fed raises its policy rate by 50 bps as widely anticipated, the Summary of Economic Projections (SEP) – the so-called dot plot – will be scrutinized for clues on future rate hikes instead by market participants.
In September, the dot plot showed that officials’ median view of the Fed’s terminal (final) rate stood at 4.6%. The terminal is likely to be revised higher in December’s SEP. A reading closer to 5.5% than to 5.0% could be seen as reflecting a hawkish outlook by the majority of members, and trigger a rally in the US Treasury bond yields, as well as the US Dollar. On the flip side, a terminal rate at or below 5.0% should allow markets to remain optimistic about a Fed policy pivot in the second half of 2023 and force the US Dollar to continue to weaken against its rivals.
Investors will also pay close attention to Gross Domestic Product (GDP) growth forecasts in the dot plot. In September, Fed officials saw the US economy expanding by 1.2%. A significant downward revision to 2023 growth projection could hurt the US Dollar while a figure close to September’s projection could have the opposite effect. If some policymakers pencil down a recession next year, that is likely to cause the US Dollar sell-off to pick up steam with market participants second-guessing whether the Fed could afford to stay on a tightening path.
On Thursday, Retail Sales data will be featured in the US economic docket ahead of S&P Global’s preliminary December Manufacturing and Services PMI reports on Friday. These data, however, are unlikely to trigger a noticeable market reaction with investors assessing the Fed’s policy announcement.
It’s also worth noting that the European Central Bank and the Bank of England will also be announcing policy decisions on Thursday. Even if the Fed causes the US Dollar to weaken, a dovish tone from either the ECB or the BOE could highlight the policy divergence and open the door for renewed US Dollar strength, limiting XAU/USD’s potential gains.
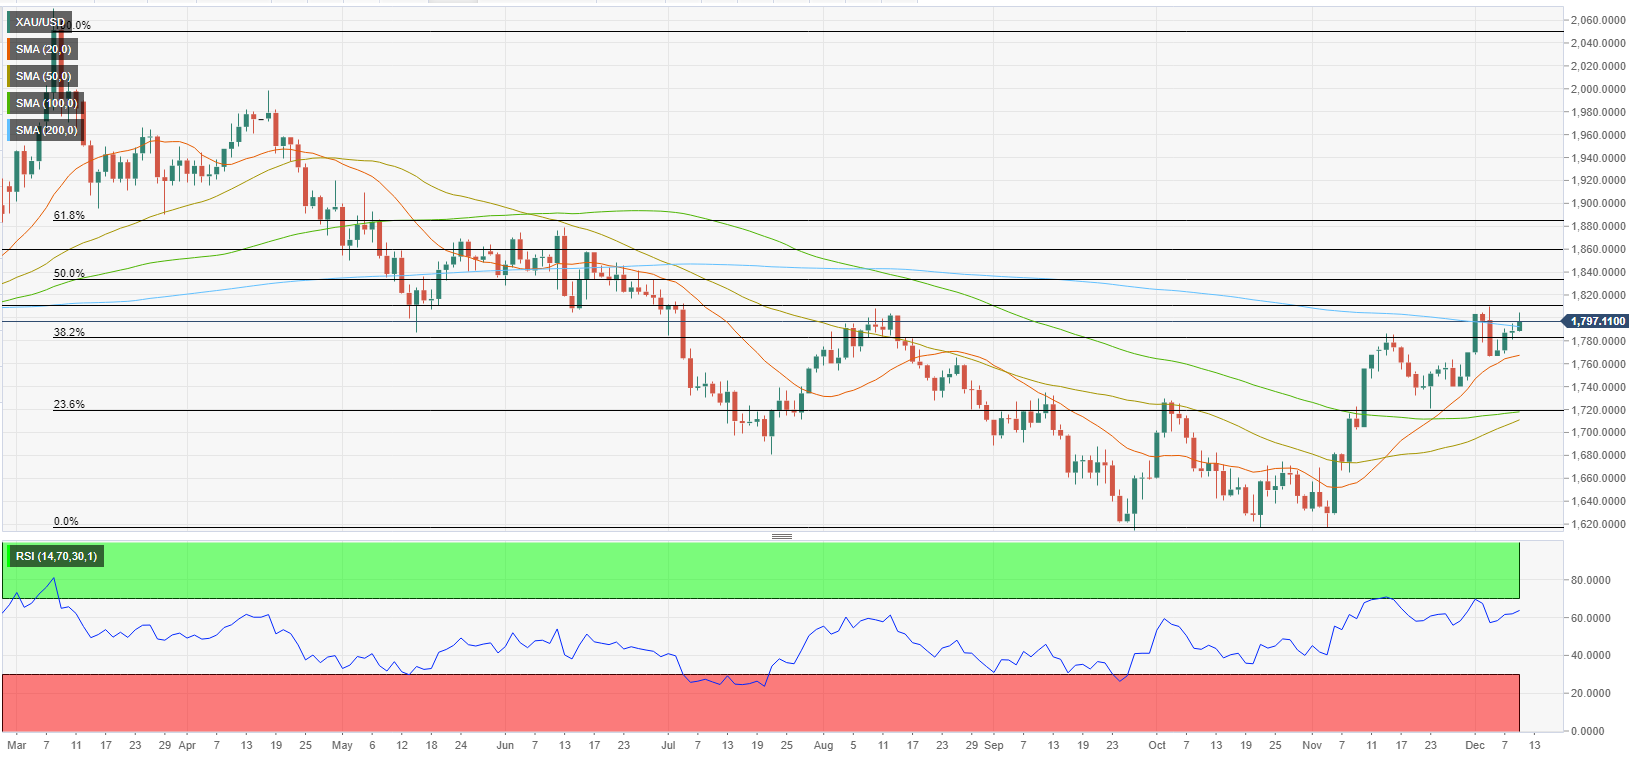
Gold Price technical outlook
The Relative Strength Index (RSI) indicator on the daily chart climbed above 60 on Friday, pointing to a buildup of bullish momentum. Additionally, XAU/USD climbed above the 200-day Simple Moving Average, which is currently located at $1,792, and stabilized, also confirming the bullish bias.
On the upside, $1,800 (psychological level, static level) aligns as initial resistance before $1,830 (Fibonacci 50% retracement of the long-term downtrend) and $1,860 (static level) next.
In case buyers fail to defend $1,792, additional losses toward $1,780 (Fibonacci 38.2% retracement) and $1,770 (static level, 20-day SMA) could be witnessed.
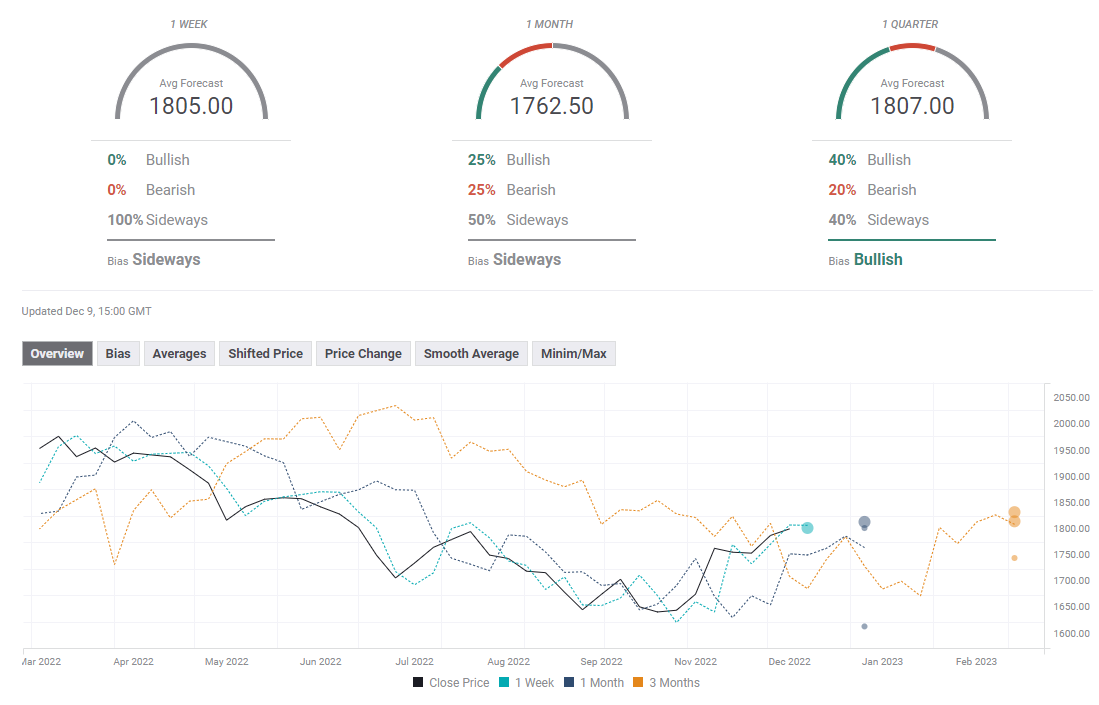
Gold price forecast poll
[ad_2]
Source link