[ad_1]
US Dollar, Euro, British Pound Vs Japanese Yen – Price Action:
- USD/JPY has risen above key resistance.
- EUR/JPY and GBP/JPY are flirting with major hurdles.
- What is the outlook for the key yen crosses?
Recommended by Manish Jaradi
Elliott Wave for Beginners
The Japanese yen is maintaining a weak bias against the US dollar following the sentiment boost after the tentative US debt deal, just as expectations of another US Federal Reserve rate hike grow. Against its peers, however, the outlook differs.
US President Joe Biden and House Speaker Kevin McCarthy on Sunday reached an agreement to raise the government’s debt ceiling, potentially averting a catastrophic default. The agreement was ready to move to Congress for a vote.
Strong US data last week, including inflation, consumer spending, durable goods orders, and hawkish rhetoric by Fed officials recently have raised the odds of a Fed rate hike at next month’s meeting. The market is pricing in a 60% chance of a 25-basis-point rate hike on June 14 Vs a 17% chance a week ago and see no rate cuts until the end of the year.
Meanwhile, inflation in Tokyo slowed in May, in line with the Bank of Japan’s expectations – last week BOJ Governor Kazuo Ueda said he expected prices to first slow and then pick up, supporting the case for the status quo on policy. The BOJ last month kept the ultra-loose policy settings unchanged, but with Japan’s inflation well above BOJ’s target, it could be a matter of time before the Japanese central bank tweaks policy.
USD/JPY Daily Chart
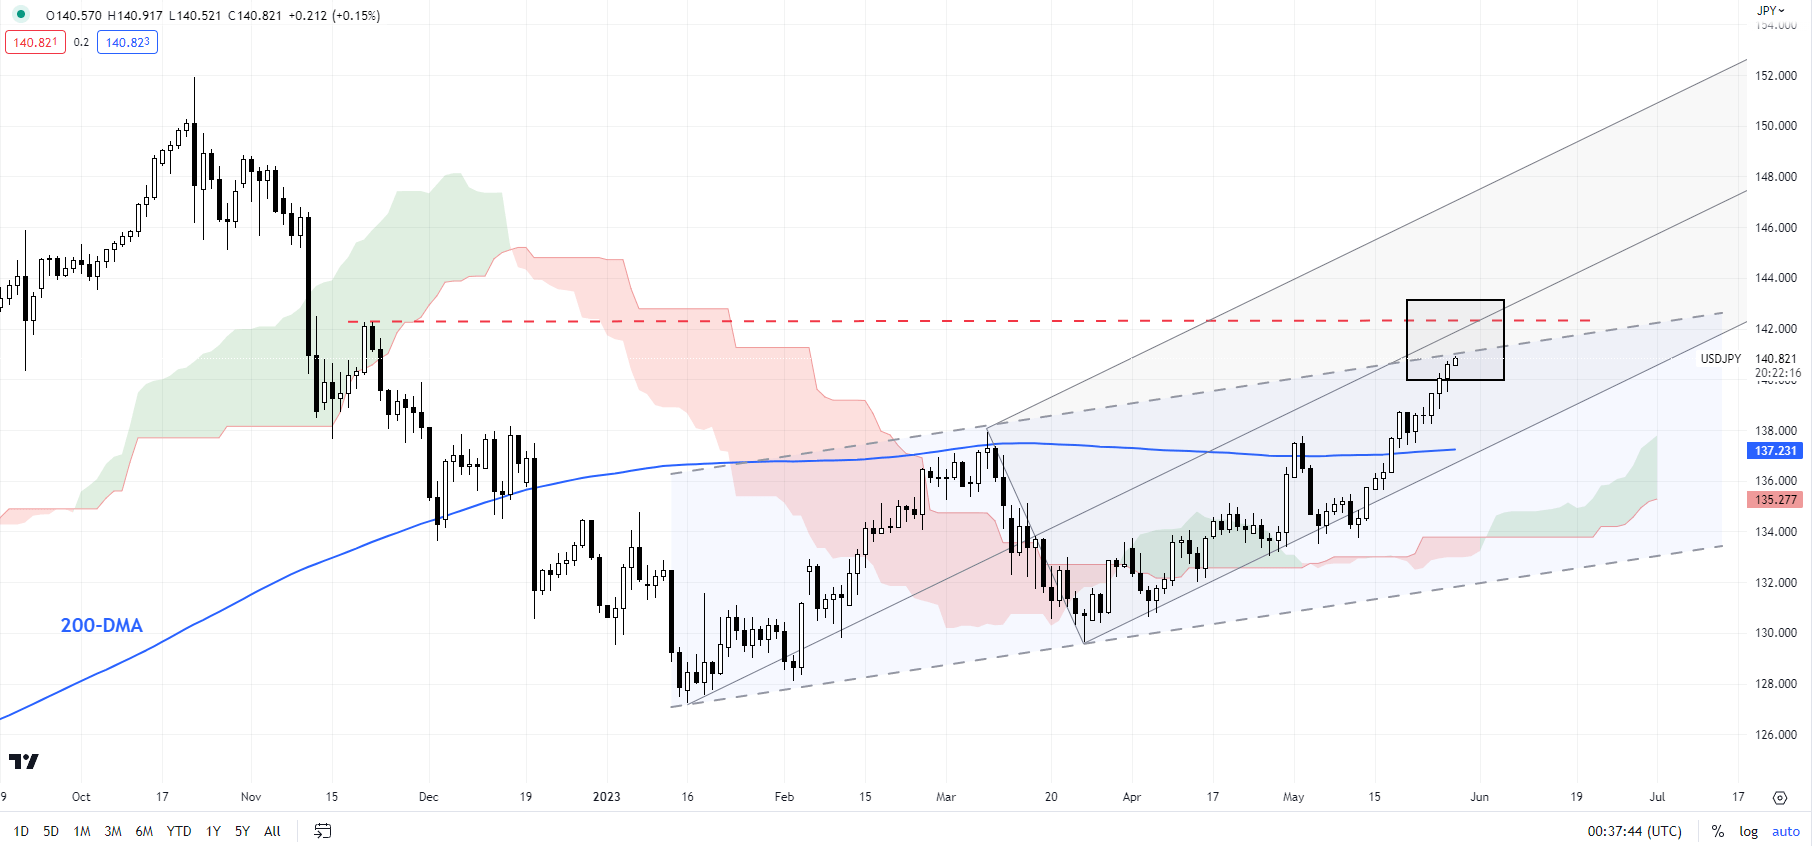
Chart Created by Manish Jaradi Using TradingView
USD/JPY: Surges above resistance
USD/JPY’s break above crucial converged resistance at the March and May highs of 138.00 has opened the way toward the late-November high of 142.25. Interim resistance is on the median line of a pitchfork channel from January (at about 141.30), roughly coinciding with the upper edge of a rising channel also from the start of the year. For the short-term upward pressure to reverse, USD/JPY would need to drop below the mid-May low of 133.75.
GBP/JPY Daily Chart
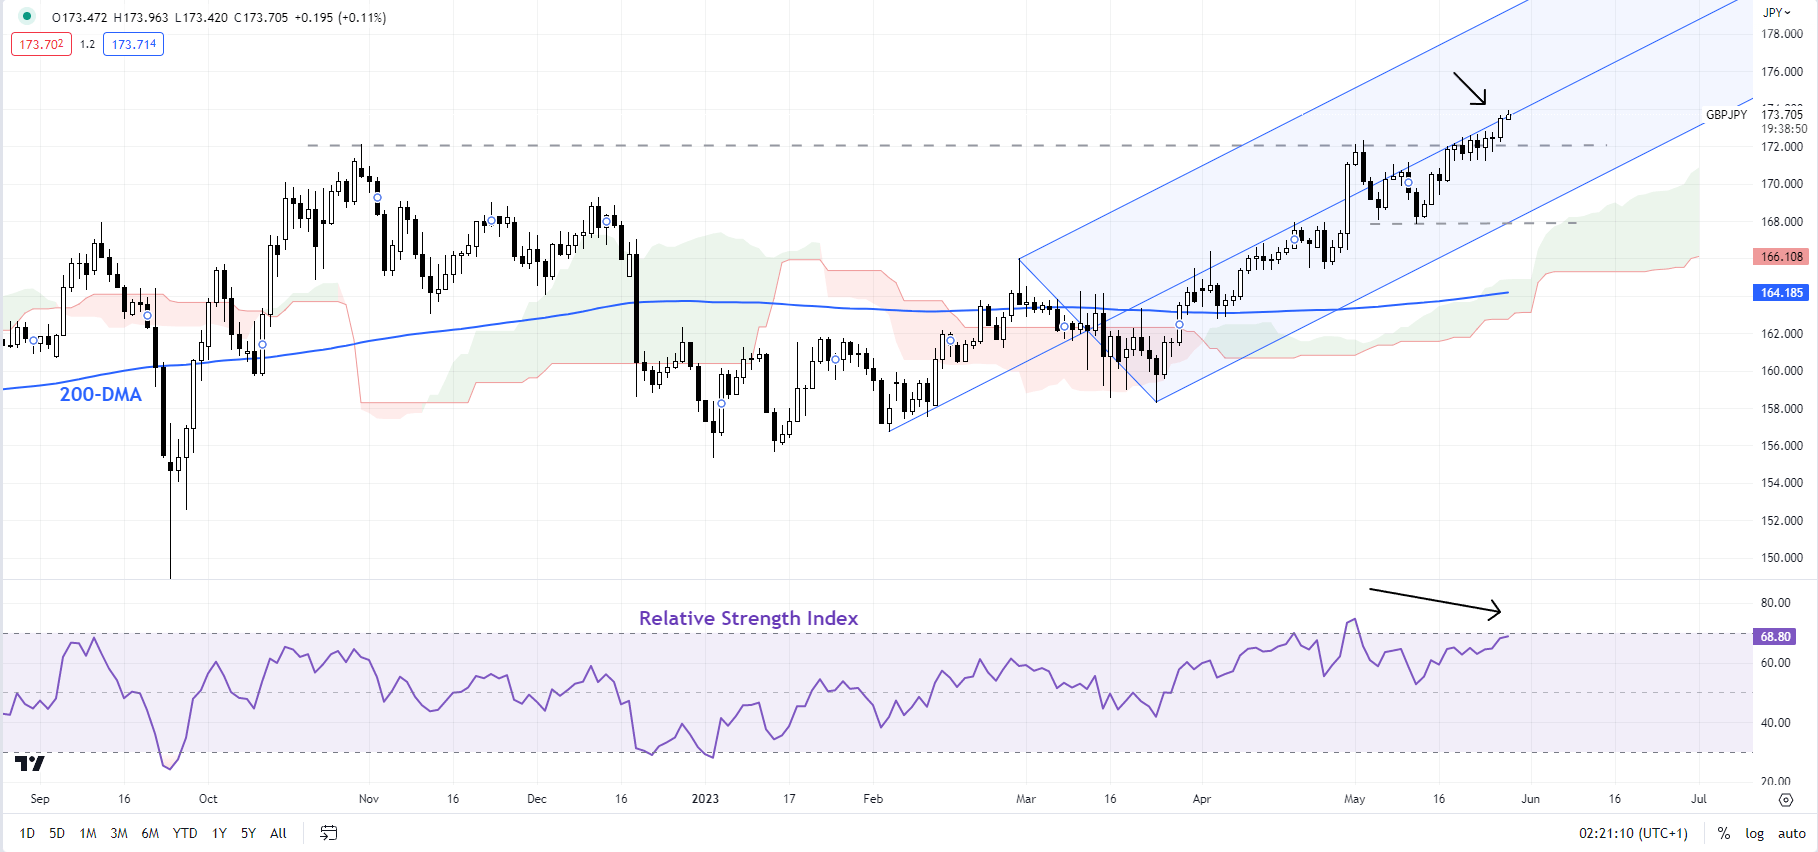
Chart Created by Manish Jaradi Using TradingView
GBP/JPY: Testing key barrier
GBP/JPY is testing a key hurdle at the October high of 172.10. Notwithstanding minor signs of fatigue on smaller timeframe charts, the momentum on higher timeframe charts continues to be up. The cross would need to drop below last week’s low of 171.20 for the short-term upward pressure to ease. Subsequent resistance is at 180.50 (the 78.6% retracement of the 2015-2016 slide).
EUR/JPY Weekly Chart
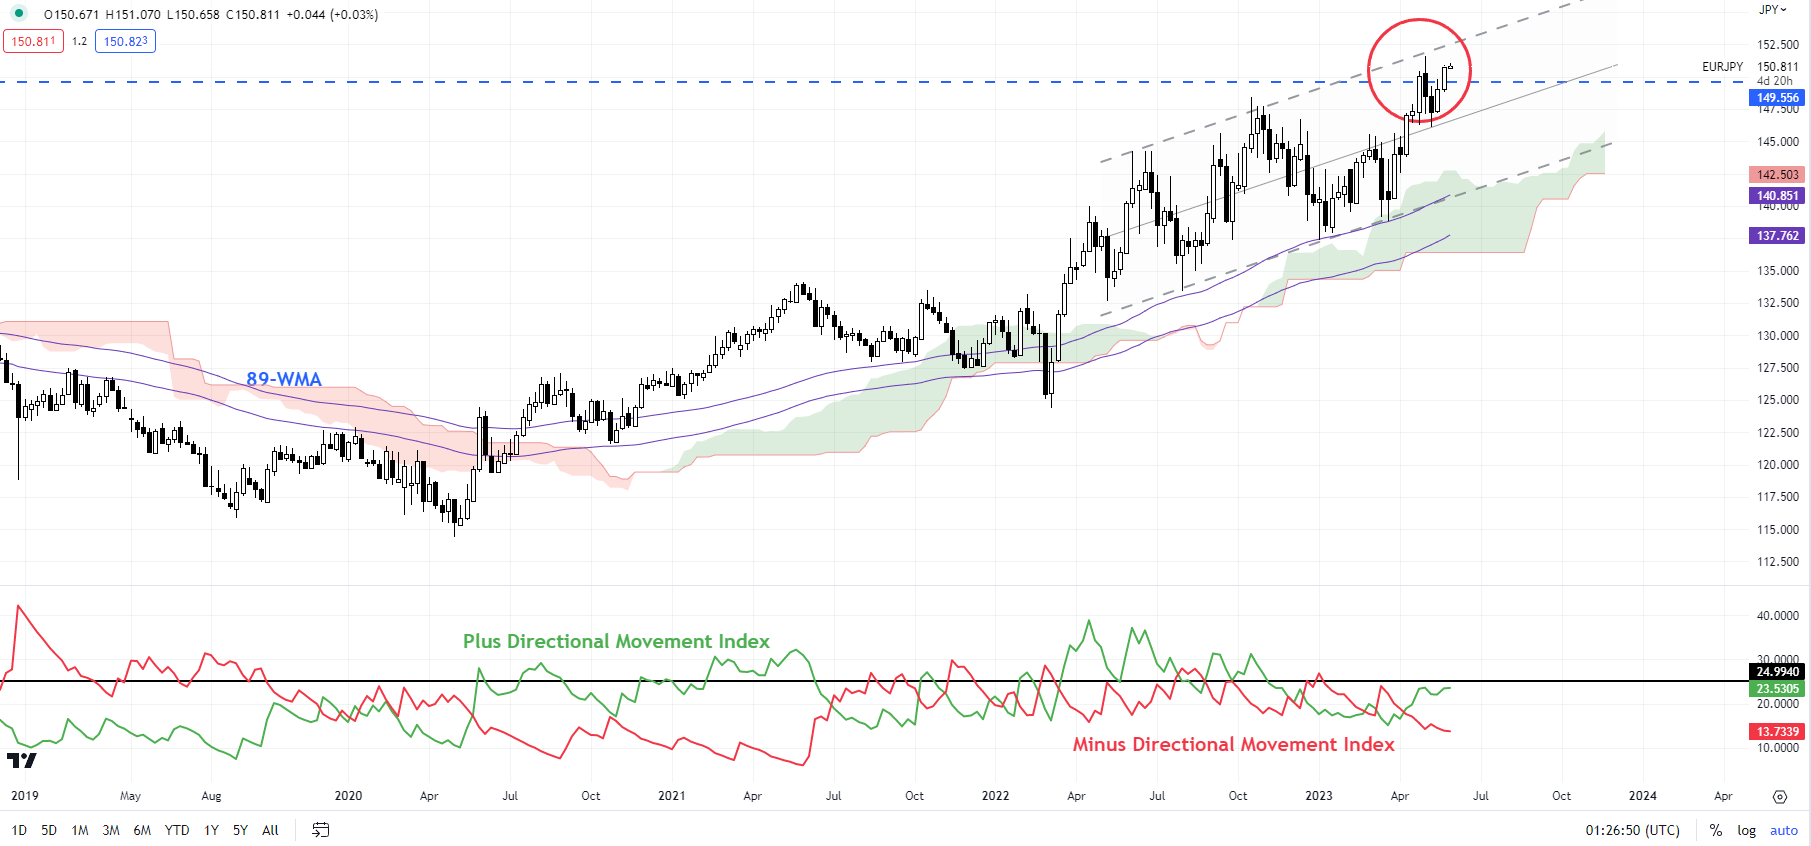
Chart Created by Manish Jaradi Using TradingView
EUR/JPY: Rally fatigue?
EUR/JPY is looking overbought on higher timeframe charts as it tests once again a tough barrier at the 2014 high of 149.75. Looking at the Directional Movement Index (DMI), the rebound from mid-May appears to be a consolidation, rather than the start of a new leg higher. The Plus DMI and Minus DMI are under 25, suggesting non-trending/range conditions. However, unless the cross breaks below 145.50-146.50 (including the 200-period moving average on the 240-minute charts) the bullish pressure is unlikely to fade away.
Recommended by Manish Jaradi
Top Trading Lessons
— Written by Manish Jaradi, Strategist for DailyFX.com
— Contact and follow Jaradi on Twitter: @JaradiManish
[ad_2]
Source link