[ad_1]
Finding Market Leaders
A market leader is a promising stock that fits the mold shared by the greatest-performing stocks in history. Market leaders will be institutional quality and have both superior fundamentals and technical performance. These stocks have the potential to double, triple, or more in a strong market uptrend. These strong uptrends are driven by aggressive accumulation by institutions.
“The number one market leader is not the largest company or the one with the most recognized brand name; it’s the one with the best quarterly and annual earnings growth, return on equity, profit margins, sales growth, and price action.”
William O’Neil
The best-performing market leaders will be part of a group theme as institutions buy shares in all the stocks in a sector due to the expectation of future growth.
For institutions to invest in a stock, it must also be reasonably liquid. Spreads should be tight and in general average dollar volume should be greater than 50 million and the average number of shares should be over 200k. Even if a stock has strong prospects, if institutions do not feel comfortable establishing a position due to the lack of exit liquidity, the stock will not meet its potential.
Comparing two similar stocks, the one that is more liquid will generally tend to have a higher valuation, simply because institutions are able to invest.
Institutions are looking for disruptive, game changing companies that have the potential to change how we work, live, and communicate. By identifying market leaders, we will be doing the same and riding the coattails of the largest money managers in the world.
During my tenure at William O’Neil + Co as a portfolio manager for Bill, I had the pleasure of witnessing firsthand how he would identify and manage the market leaders in different market cycles.
O’Neil’s superpower was his ability to zero in on these names, establish positions, concentrate his portfolio in the very best of them, and then ride the trends until the technicals told him the move was at an end.
O’Neil could easily have his entire portfolio (an extremely large sum) concentrated in only one of the very best names. He would build these positions over time as the market showed him he was correct and handle them diligently following his rules.
The weekly timeframe was extremely important to O’Neil. He could be 200% long in just a few names with everything crashing on a Tuesday and he would be cool as a cucumber in our meetings. It was only on Fridays that he would determine how to move forward, and often with these high-quality names, they would have recovered from the shakeout by that point.
This is always something I remember when I consider selling a position. I ask myself if the stock is truly negatively changing character or If I should be patient and let it work.
Catching just one market leader with size can drastically benefit your yearly performance and even change your life.
With a 30% position, if you are able to achieve a double in a stock in a year, that by itself contributes 30% to your account. And if you are able to ride a market leader through a full 12-18 month cycle and it is able to achieve a 300% return, then just with that one stock you have more than doubled your portfolio value.
The goal should be to buy right and sit tight as much as possible, easier said than done. Market leaders will appear every year, with varying performance potential depending on the strength of the sector and market.
Over the years I’ve been fortunate to participate in many market leaders when I was working as a PM for Bill, later managing my hedge fund in New York, and then currently managing my own capital.
Here is an excellent list of some of these names to go back and study:
- AOL
- BIDU
- QCOM
- SCHW
- AAPL
- AMZN
- TSLA
I would highly recommend you watch this video I did with Richard discussing my trade of SCHW:
Technical Setups to Find TMLs
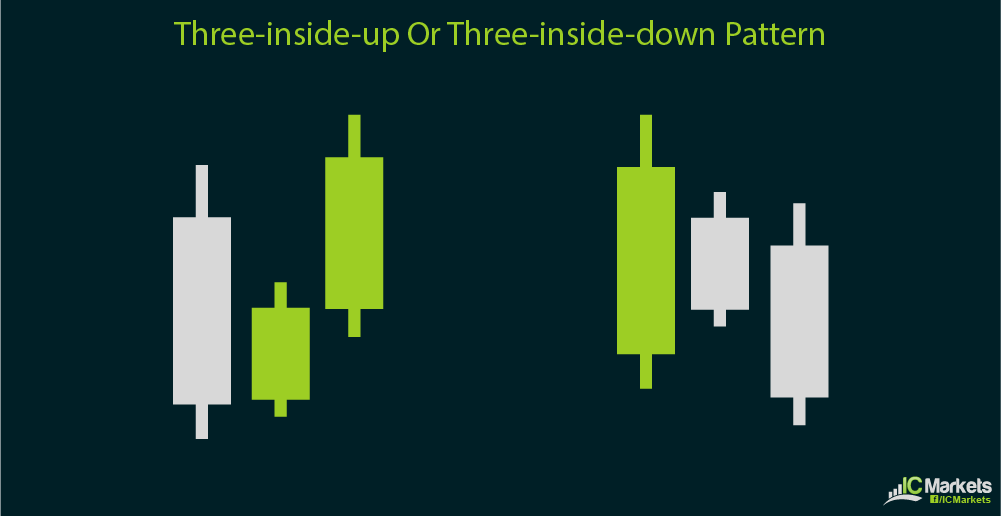
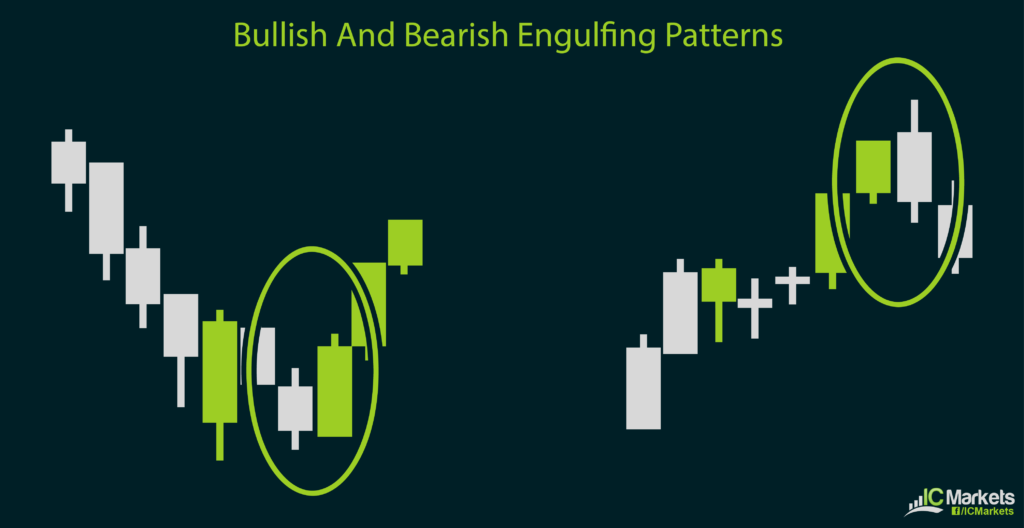
Although every individual stock is somewhat unique, due to human nature the same patterns repeat over and over again.
Market Leaders generally emerge from early stage bases such as the IPO Base or a similar consolidation early in a strong new uptrend.
Other early stage bases/patterns to look for
- Cup
- Cup w/ Handle
- Double Bottom
- Flat Base
- Inverse Head and Shoulders
Google Model Book Move from IPO Base

Market leaders are often newer companies with more room for innovation that have come public within the past few years. These moves can often emerge after a stock has traded sideways for quite a while as it mature and institutions wait for the first few quarters of earnings reports
SHOP Model Book move

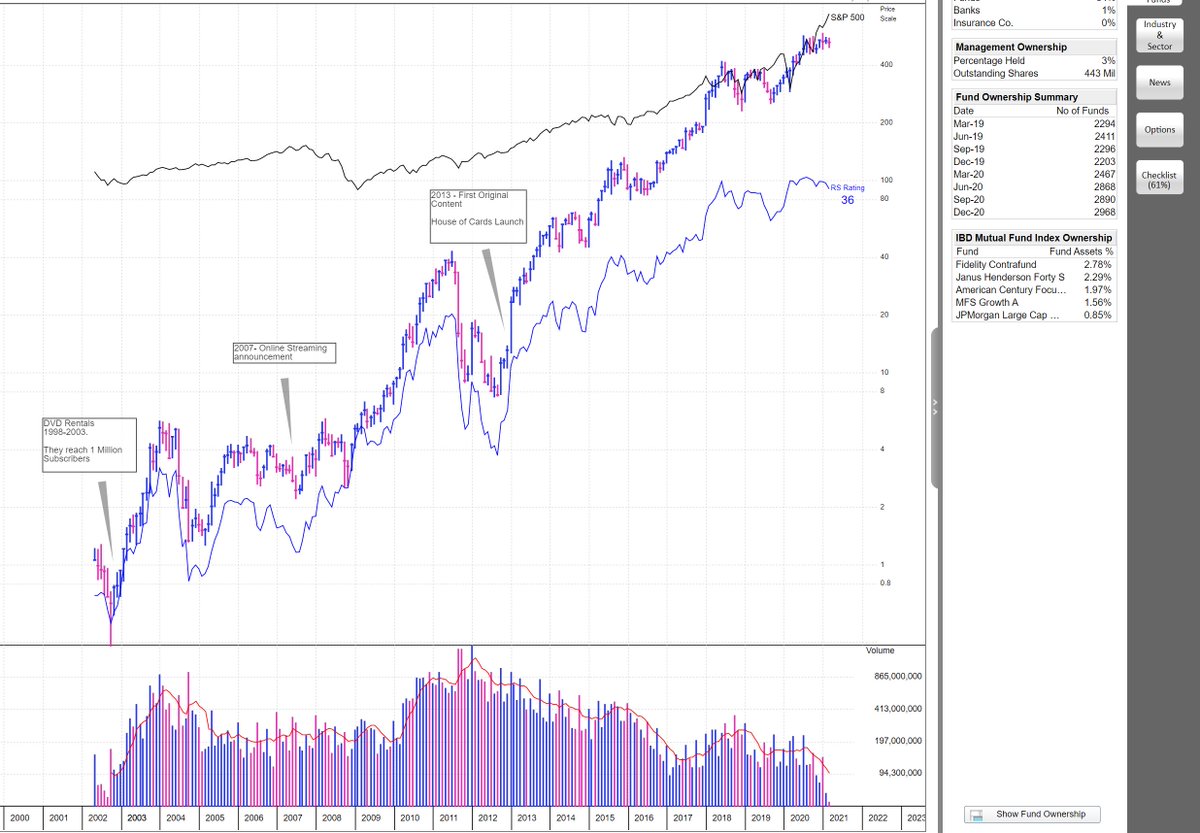
However, keep in mind that a Market Leader can also be a company that has reinvented itself and developed a new game changing product. This is where the N in CANSLIM can step in. Watch for long term bases where the fundamentals of the company are drastically improving.
NFLX Example of a company reinventing itself.
In general, stocks that can become market leaders will share these technical characteristics
- Respect for Key Moving Averages
- Large gap ups on volume
- High liquidity
- Tight trading ranges
- Relative strength during market corrections
- Making new highs, both in price and relative strengthTSLA in 2020 is a great stock to study:

I had the unique opportunity to build the WON firm’s 1998-2000 Model Book with Mike Webster and Charles Harris.
I highly recommend to everyone reading that they build their own versions of model books. Take the ~10 best performing liquid stocks from each year and study their price movements. Look for entries, exits, and consider how you would have managed a position. Studying winning stocks is the best way to improve your technical eye and prepare for future leaders.
In creating the Model Book at WON, I had several key takeaways. The first was that the trends of these stocks are so strong that once identified, there will be multiple strong buy points where you can hop on for the ride. Everyone is worried about buying the low, finding the best stock and purchasing it just as it is moving off the lows of its base. This is unnecessary and difficult to do consistently due to volatility.
Wait instead for a higher probability buy point where you can manage risk tightly and logically. This realization led to the development of the consolidation pivot setup, where the stock forms early pivots up the right hand side of its base before the true breakout. In a stock that has all the characteristics of a potential market leader, these pivot points are excellent spots to build your position. Then on the true breakout you can simply add the last piece of your position and sit with an excellent cost basis.

The other important takeaway that is well worth sharing is that through careful study of Market leaders, you can determine rotation and the overall market conditions.
The reason we call these stocks leaders is because they often serve as canaries in the coal mine. They appear before the indexes turnup off of correction lows and break down before we see the market lose steam.
Through careful study of the price and volume action of leaders, you will have an excellent feel for where we are in the market cycle and whether you should be getting aggressive or pumping the brakes.
I keep my screening very simple, I look for price moves on volume.
UP ON VOLUME – Finds stocks that are currently up a percent or more on heavy volume.

RELATIVE STRENGTH – Broad screen showing all stocks above $7.00 with its 12 month RS making new highs.

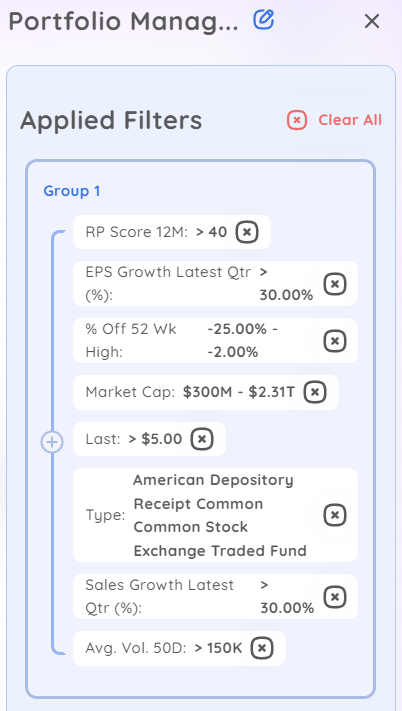
PORTFOLIO MANAGER – My basic screen that filters out most of the less fundamentally sound stocks.
I also run an IPO screen once a week. Constantly running these four screens allows me to track rotation in real-time. This shows me what groups are leading and where I should be focused.
So once you have identified a stock as a market leader how should you trade it?
The first thing you should do is look to the left on the chart and determine the character of the stock. Some may respect shorter term moving averages like the 21 DMA, others may respect the 50 DMA or 65 ema. This will be useful in helping you determine when the stock is behaving properly or exhibiting a character change.
Also look at how stretched it can be from these moving averages before needing to consolidate and form a new base. This will help you determine when you should take some short term profits and let your core position work. For this I love to use the 10 day moving average especially.
When in the initial position building phase, I like to buy portions of my position as the stock moves through different pivot points. With each new buy I make sure that my stop loss is both tight and logical meaning that I am buying versus a clear level which could be the low of the week, a prior pivot on a pullback, or a key moving average.
This method allows you to concentrate in a promising stock as it is developing its trend while still managing your risk. Only add to the position when the market is showing you that your initial buys were correct and you are at a profit. One of the major trading sins is averaging down on a position and trying to force your will on a stock.
Depending on your experience level as well as your confidence, and risk tolerance, your final position in a market leader will be different. For me it is also very dependent on the current market conditions. If I have been trading well and am having a strong year, then I feel more comfortable trading larger. However, if the market is very choppy I will start with very small position sizing until those initial buys are rewarded.
Discussing a hypothetical example in a strong market, I look to build a position of 40-60% of my account on the initial break of a declining tops line of the base. Ideally, I want this to line up with a launching pad setup, retake of the 50 day moving average, outside day on huge volume… as many things I can have going for me that tells me the character of the stock has changed and its ready to move up from its base.
On this initial position I am looking to keep my risk managed extremely tightly, 2% or less. I’ll buy versus a moving average or pivot, a spot that is both tight and logical. At these key spots in the base I will also look on intraday charts and pivots to potentially further fine tune my entry and stops. I have no problem taking tiny paper cuts 5 or more times to establish a strong position in a stock that could be a big winner because it only has to work one to make my year.
Remember though, I only look at intraday spots at key levels based on the higher timeframes.
After this core position is in and the stock continues to build up the right side of the base, I will add to it at consolidation pivots, each time progressively less than the previous buys to keep my cost basis down. I will add on/buy the true base breakout but in recent years with added volatility I’ve found that many stocks falter at this level and need a short term pullback before continuing upward.
Once a stock is out of its base and trending well, I will trade around the position using extensions from moving averages such as the 10 day moving average to proactively sell a portion (usually 10% of the account) into strength to better sit through consolidation periods.
The end goal is to have my full account in the 2-3 strongest stocks in the market during a powerful trend. This is a high level of concentration but I have found that this works best for me and my trading style.
So when does a Market Leader’s trend end and when would I sell my position. Figuring this out is just as, or even more important than entry criteria. O’Neil’s research suggests that the biggest moves in market leaders typically last 12-18 months. In my experience it is difficult to stay in a stock for the full length of its run but just capturing a chunk of this move can be especially lucrative.
When considering selling a position, I look for character changes such as breaking key moving averages or rate ascent changes to identify if the trend has changed. As a stock breaks down I will let it go in chunks and by the time we are below the daily 65 EMA I will be out completely. I have no problem buying the stock back higher if it recovers and sets up again.
You can also use weekly charts to determine when to sell a stock and use Stan Weinstein’s Stage Analysis. This is particularly helpful if you are a long term position trader or investor or work full time and can’t watch the market intraday.
The key thing to remember here is that in a strong market you want to give market leaders the benefit of the doubt as much as possible while also managing your risk and protecting profits. Stick with your positions as long as the stock has not violated your sell rules. Market leaders can run a whole lot further than we think.
However, once they do break they can experience incredible downtrends as we have seen in 2022. Market leaders will also often break down before the market giving us a fair warning that a correction is about to take hold.
The most important ideas that I would like you to take away from this article are as follows:
- True Market Leaders are special stocks that have the potential to change how we work, live, and communicate
- They combine the best fundamental growth numbers, story, with superior price performance.
- Identifying them and their behavior informs us on the health of the market.
- In a strong uptrend you want to have your portfolio concentrated in at least a few of these market leaders from the strongest industry groups.
At the end of a trend they will also provide information about a potential change in market conditions.
To further your understanding of market leaders I would highly recommend that you go through the document from O’Neil where he covers America’s greatest stocks with both technical and fundamental commentary.
How to Find and Own America’s Greatest Opportunities
You should also review the model books we have put together over the past few years for updated examples.
[ad_2]
Source link