[ad_1]
With a little more than three weeks to go, the 2020 US elections is just around the corner.
November 3 sees Democratic nominee Joe Biden, a former vice president from 2009 to 2017 during the Barack Obama administration, go head-to-head with incumbent Republican president Donald Trump.
As of writing, the national polls, sourced from fivethirtyeight.com, reveal Biden leads by eight points, and has remained on top since the beginning of the year. Impressively, Biden’s lead widened heading into June and has fluctuated an average of 8-9 points since. In fact, Biden leads Trump in the bulk of opinion polls.
But can we trust the polls this time?
Trump won the 2016 election despite the majority of polls suggesting Hilary Clinton would come out on top. For the fifth time in American history, the 2016 election produced a mismatch between the popular vote and the electoral college outcome.
In some respects, though, 2016 polls were accurate. FiveThirtyEight, a website owned by ABC News that focuses on opinion poll analysis, projected Hillary Clinton would win the popular vote by three percentage points – Clinton won by about two points. The problem was inaccurate polling at state level, in particular Michigan, Pennsylvania, and Wisconsin. Clinton lost all three of these states (critical in the electoral college), despite being a heavy favourite. According to New York Times polling expert Nate Cohn, there were two reasons pollsters got it wrong. Firstly, late voters sided with Trump in large margins. Secondly, Trump got some people to vote who pollsters weren’t expecting to make the effort.
Historical Performance – Presidential Election Cycle
Developed by Stock Trader’s Almanac founder Yale Hirsch, the ‘Presidential Election Cycle Theory’ states the first couple of years of any presidential term often generates uninspiring returns. The subsequent two years, however, tends to produce stronger performance. The rationale behind this theory is the incumbent president’s agenda, during the first two years, takes time to have an effect on the economy.
As you will see, though, the Presidential Election Cycle theory is not fool proof and previous results don’t always guarantee future performance.
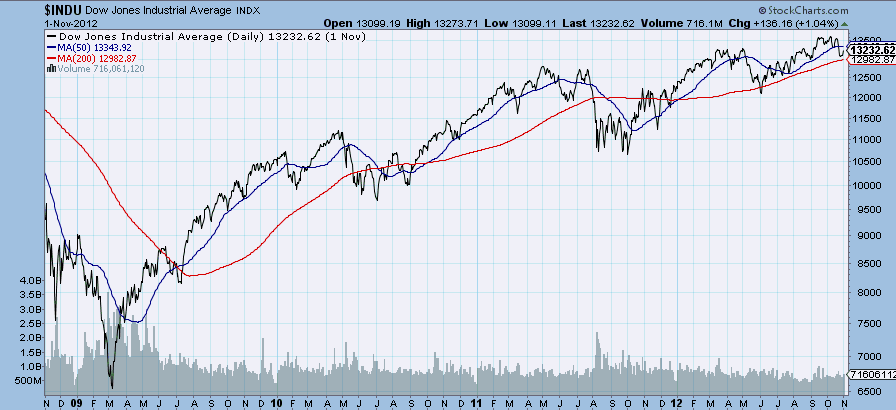
An example of this (see figure A) can be seen in the first two years of Barack Obama’s first term. The Dow Jones Industrial Average (consists of 30 large publicly-traded US companies) outperformed in the first two years, more so than his subsequent third and fourth year.

(FIGURE A: Dow Jones Industrial Average chart sourced from https://stockcharts.com/)
A more recent example (figure B) can be found during the first year of Donald Trump’s presidency, in which the Dow Jones Industrial Average clocked record highs.
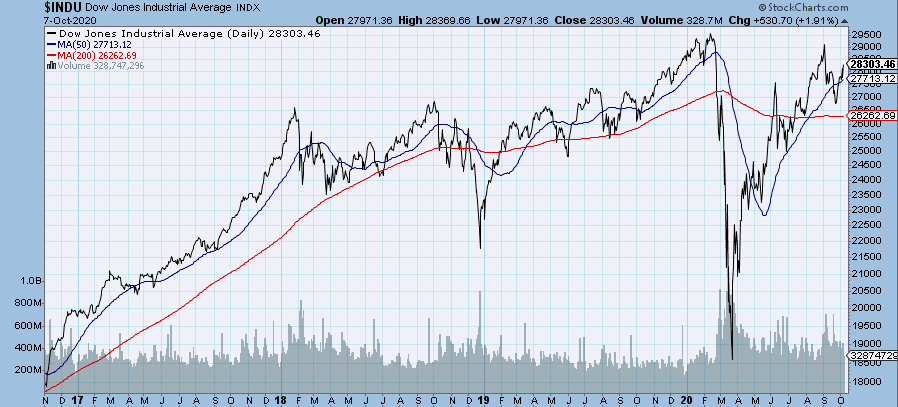
(FIGURE B: Dow Jones Industrial Average chart sourced from https://stockcharts.com/)
Previous years seem to be more respectful of the Presidential Election Cycle theory.
Take 1936-1940, for example, Roosevelt’s 2nd term in office (figure C). The Dow Jones Industrial Average sharply declined during his first year and through the early stages of his second year, before chalking up a recovery. The subsequent third and fourth years produced zero gains, however.
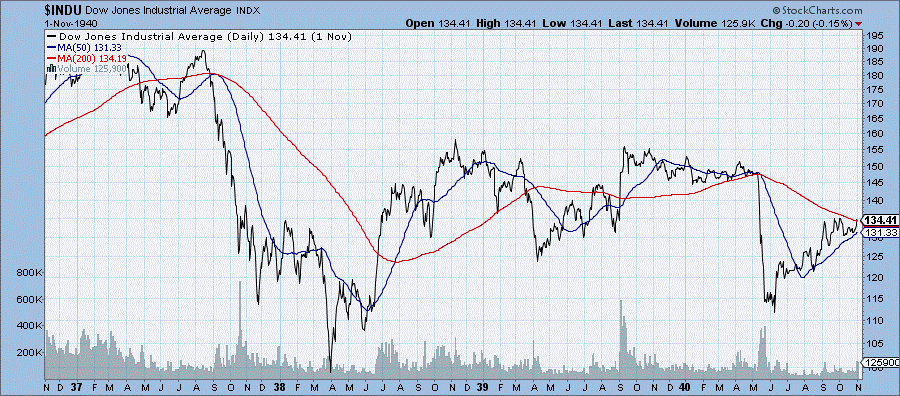
(FIGURE C: Dow Jones Industrial Average chart sourced from https://stockcharts.com/)
Roosevelt’s third term (figure D), 1940-1944, showed a considerable decline in the first year and bottomed during the second year. Years three and four continued to outperform.
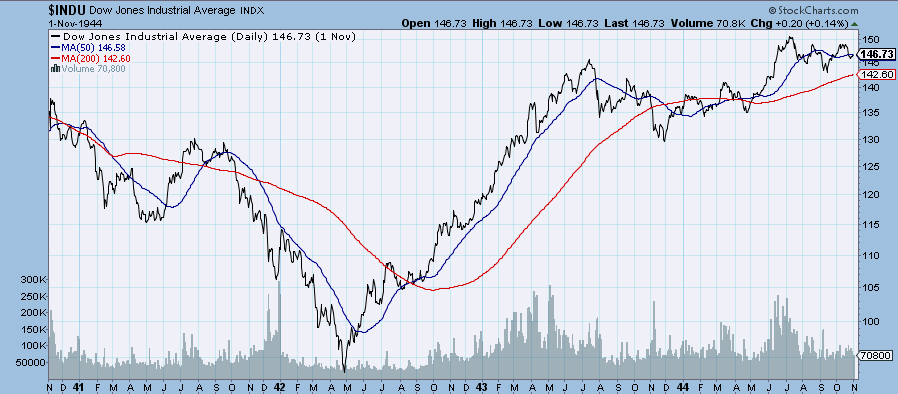
(FIGURE D: Dow Jones Industrial Average chart sourced from https://stockcharts.com/)
Election Day
From 1984 to the present day, research reveals that approximately 80% of the time the Dow Jones Industrial Average observes gains on the day of elections. Interestingly, though, more than 75% of the time the stock market retreats the following day.
Barrack Obama’s win on November 8, 2008 sent the Dow higher by more than 3%, and his second re-election on November 6, 2012 also saw the Dow rally 1%. Donald Trump’s win over Hilary Clinton on November 8, 2016, despite considered to be an upset (and a result that should’ve sent stocks lower), also witnessed the Dow rally 0.4% (figure E).
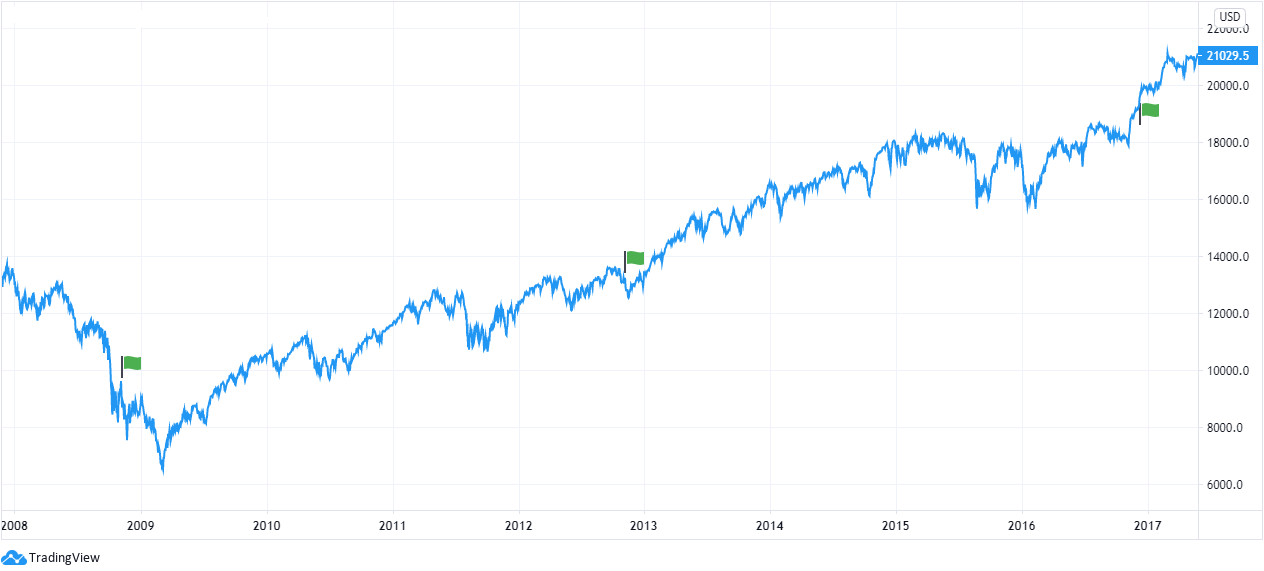
(FIGURE E: Dow Jones Industrial Average chart provided by TradingView)
Stock Market Heading into Elections
Based on the three major US equity benchmarks (see figure F – index CFDs), the S&P 500 (measures the performance of 500 large companies listed on stock exchanges in the US), the Dow Jones Industrial Average and the Nasdaq Composite (a market index measuring over 3000 of the equities listed on the Nasdaq stock exchange), US stocks trade strongly as we near election time. Both the S&P 500 and Nasdaq clocked fresh all-time peaks at the beginning of September, with the Dow not far behind fresh all-time highs (see figure F).
Interestingly, some analysts believe the stock market’s performance in the three-month period prior to the elections can forecast the outcome. Positive returns in the stock market in the run-up to election day signals an increased likelihood the incumbent party could win. Conversely, underperformance in the stock market during the same period tends to estimate an opposition party win.
As can be seen from figure F, all three equity benchmarks have mostly advanced as we head into the 2020 elections.
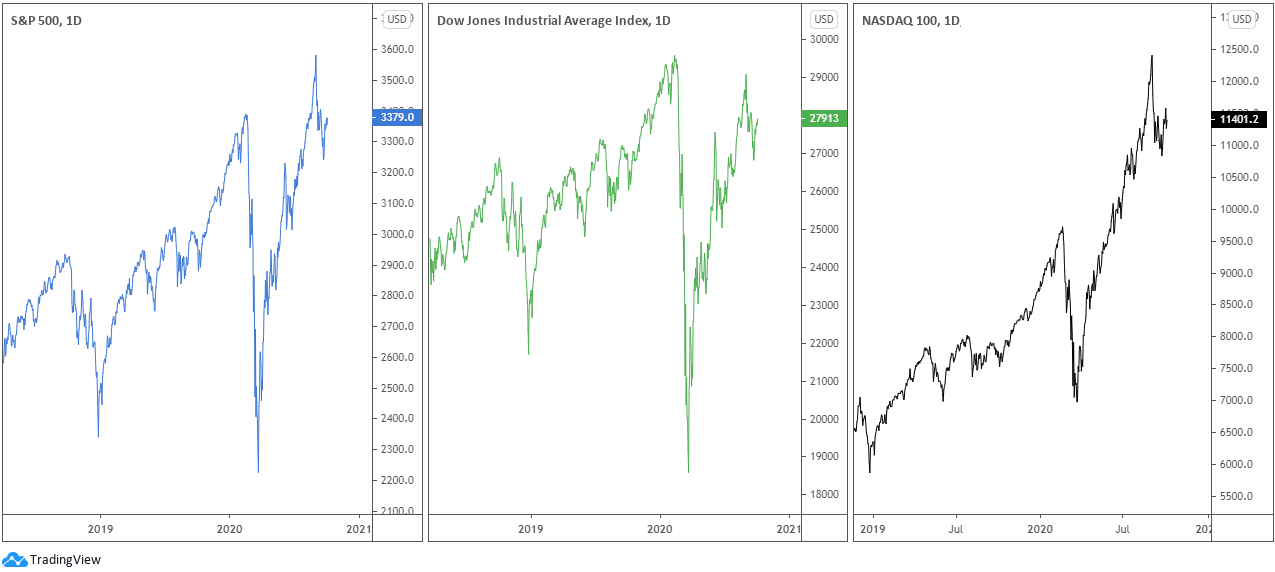
(FIGURE F: US Stock charts provided by TradingView)
The accuracy, completeness and timeliness of the information contained on this site cannot be guaranteed. IC Markets does not warranty, guarantee or make any representations, or assume any liability regarding financial results based on the use of the information in the site.
News, views, opinions, recommendations and other information obtained from sources outside of www.icmarkets.com.au, used in this site are believed to be reliable, but we cannot guarantee their accuracy or completeness. All such information is subject to change at any time without notice. IC Markets assumes no responsibility for the content of any linked site.
The fact that such links may exist does not indicate approval or endorsement of any material contained on any linked site. IC Markets is not liable for any harm caused by the transmission, through accessing the services or information on this site, of a computer virus, or other computer code or programming device that might be used to access, delete, damage, disable, disrupt or otherwise impede in any manner, the operation of the site or of any user’s software, hardware, data or property.
[ad_2]
Source link