[ad_1]

USA500 ended bearish last week, closing just slightly above its 3-week low. The slump was mainly triggered by better than expected US economic data. On Friday, the November US PPI data suggested that there is still upside risk for inflation, which might eventually complicate the route for the Fed’s monetary policy shift.

Fig.1: US Stock Heatmap. Source:TradingView
As a result, most of the US stocks’ gains were wiped out within the week, suffering losses at varied degree. Netflix (NLFX) and Tesla (TSLA) were the companies that managed to close with gains over 3%, followed by Broadcom (AVGO) (+2.57%).
Broadcom, Inc. is one of the world’s biggest semiconductor companies, founded in 1961. It plays a major role in the semiconductors industry, specializing in designing, developing and supplying semiconductor and infrastructure software solutions. It operates through the semiconductor solutions segment (manages movement of data in data center, enterprise, telecom and embedded networking applications) and infrastructure software segment (provides a portfolio of mainframe, enterprise and storage area networking solutions).
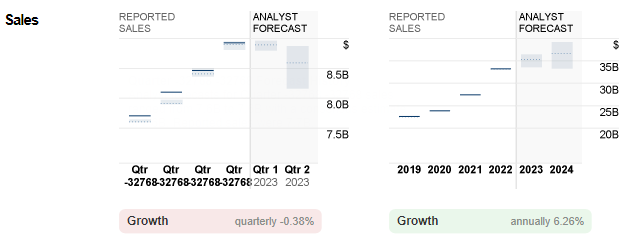
Fig.2: Reported Sales of Broadcom versus Analyst Forecast. Source: : CNN Business
The company released its Q4 2022 results last Friday. Its sales hit $8.9B, in line with consensus estimates. This brought the overall sales for the 2022 fiscal year to $33.2B, up over 20% from a year ago.
Based on the financial highlights, semiconductor solutions made up 79.4% of total net revenues, at $7.09B (+25.9% (y/y)); networking revenues at $2.5B (+30.0% (y/y)); storage connectivity revenues at $1.2B (+50% (y/y)); broadband revenues at $1.0B (+20.0% (y/y)); wireless revenues at $2.1B (+13.0% (y/y)); infrastructure software revenues at $1.84B (+3.7% (y/y)).

Fig.3: Reported EPS of Broadcom versus Analyst Forecast. Source: CNN Business
EPS was reported at $10.45, beating market estimates at $10.28. Throughout the year, its EPS stood at $37.64. Last year, it was at $28.01. In general, Broadcom has been performing well as it topped consensus estimates four times over the last four quarters.
The company will release its Q1 2023 fiscal result on 16th March. Analyst forecast for Sales and EPS were $8.9B and $10.18, respectively. The management remains optimistic by raising revenue guidance for Q1 2023 in line with analyst forecast, up 16% from the prior year period. It also announced a share buyback program and increased dividend by 12% – these may imply a robust financial position of the company.
On the other hand, it is reported that Broadcom will be under investigation by EU antitrust regulators regarding its $61B acquisition plan on VMware Inc. The latter provides cloud-computing management, infrastructure, networking, security and digital workspaces, and Broadcom believes a successful deal could help it further expanding software businesses. Broadcom CEO Tan stated that he is confident the acquisition deal will be completed by the end of next year.
Technical Analysis:

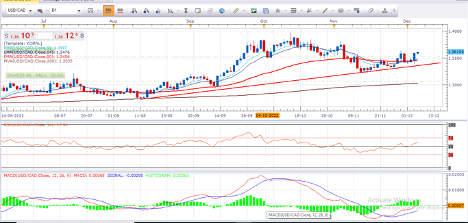
The #Broadcom share price has been riding on a downtrend since the beginning of this year despite better-than-expected financial results. The sell-off was driven by the gloomy market outlook over the US economy, leading to many sectors being adversely affected. The company’s share price hit its yearly low in October, at $414.72. This point was FR 50.0% which extends from the low in March 2020 ($155.60) to the high in December 2021 ($676.86). The asset experienced a technical rebound and is currently testing the resistance zone $545-$555. A successful breakout above the zone would encourage the bulls to continue testing the next resistance at $575 and $620. On the other hand, a retrace below said level would bring the support $515 into focus. This level also intersects with 100-day SMA. The next support lies at $475 and $415.
Click here to access our Economic Calendar
Larince Zhang
Market Analyst
Disclaimer: This material is provided as a general marketing communication for information purposes only and does not constitute an independent investment research. Nothing in this communication contains, or should be considered as containing, an investment advice or an investment recommendation or a solicitation for the purpose of buying or selling of any financial instrument. All information provided is gathered from reputable sources and any information containing an indication of past performance is not a guarantee or reliable indicator of future performance. Users acknowledge that any investment in Leveraged Products is characterized by a certain degree of uncertainty and that any investment of this nature involves a high level of risk for which the users are solely responsible and liable. We assume no liability for any loss arising from any investment made based on the information provided in this communication. This communication must not be reproduced or further distributed without our prior written permission.
[ad_2]
Source link