
[ad_1]
- Gold turned north and erased the previous week’s losses.
- The technical picture suggests that XAU/USD could test $2,000 in the near term.
- Markets are likely to turn choppy in the second half of next week.
Gold gathered bullish momentum and gained more than 2.5% this week as the US Dollar (USD) declined alongside the US Treasury bond yields. Next week’s economic docket will not offer any significant macroeconomic events and participants could watch XAU/USD’s technicals for trading opportunities.
What happened last week?
In the absence of high-tier data releases, Gold managed to stage a technical upside correction on Monday as sellers booked their profits after XAU/USD tested the 200-day Simple Moving Average (SMA) below $1,940.
On Tuesday, Gold gathered bullish momentum and advanced beyond $1,970. Inflation in the US, as measured by the change in the Consumer Price Index (CPI), declined to 3.2% on a yearly basis in October from 3.7% in September, the Bureau of Labor Statistics (BLS) reported. The Core CPI, which excludes volatile energy and food prices, rose 4% in the same period, down slightly from the 4.1% increase recorded in September. The benchmark 10-year US Treasury bond yield fell more than 3% after soft inflation data and broke below 4.5%, while the USD came under strong selling pressure. In turn, XAU/USD gained more than 1% on the day.
Retail Sales in the US declined 0.1% on a monthly basis in October, the US Census Bureau reported on Wednesday. This reading came in better than the market expectation for a 0.3% contraction and helped the USD stabilize following the previous day’s sharp decline. Thursday’s data, however, showed that the number of first-time applications for unemployment benefits climbed to 231,000 in the week ending November 11 from 218,000 and didn’t allow the currency to extend its recovery. Furthermore, the Federal Reserve (Fed) announced that Industrial Production contracted by 0.6% on a monthly basis in October. After Wednesday’s choppy action, Gold regained its traction and advanced toward $1,980.
As US Treasury yields continued to stretch lower on the last trading day of the week, Gold preserved its bullish momentum and advanced to its highest level in over a week above $1,990. Reuters reported that Fed Vice Chair Philip Jefferson told a US senator that the process of balance sheet wind-down faces no imminent end. “Under plausible assumptions, the size of the balance sheet could decline considerably further before reserves reach the level consistent with the ample reserves operating framework,” Jefferson wrote in response to Republican US Senator Rick Scott, who posed a series of questions regarding the central bank’s balance sheet.
Meanwhile, demand-side dynamics also provided a boost to Gold prices this week. “Indian buyers brushed off record high local prices this week making gold purchases during the Diwali festival week in the country, while China premiums remained buoyant after the top-buyer continued to accumulate gold holdings,” Reuters reported.
Next week
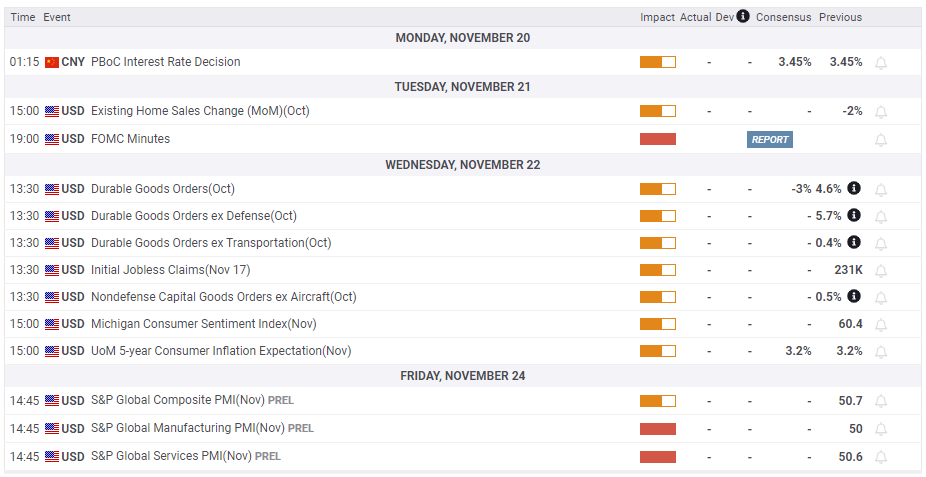
The Fed will release the minutes of the October 31-November 1 policy meeting on Tuesday. Market participants are unlikely to pay attention to this publication, since the focus has already shifted to the possible timing of a Fed policy pivot next year. According to the CME Group FedWatch Tool, a no change in the interest rate in December is nearly fully priced in and markets see a less than 15% chance the policy rate will remain at 5.25%-5.5% by June next year.
October Durable Goods Orders will be featured in the US economic docket on Wednesday alongside the weekly Initial Jobless Claims data. The market reaction could be straightforward to these figures, with worse-than-forecast numbers weighing on the USD and stronger figures supporting it.
US stock and bond markets will be closed on Thursday in observance of the Thanksgiving Day holiday. On Friday, both markets will operate half day.
S&P Global will release the preliminary Manufacturing and Services PMI surveys for November on Friday but the market action is likely to remain subdued amid thin trading conditions.
Investors could pay close attention to XAU/USD’s technical developments to find new opportunities.
Gold technical outlook
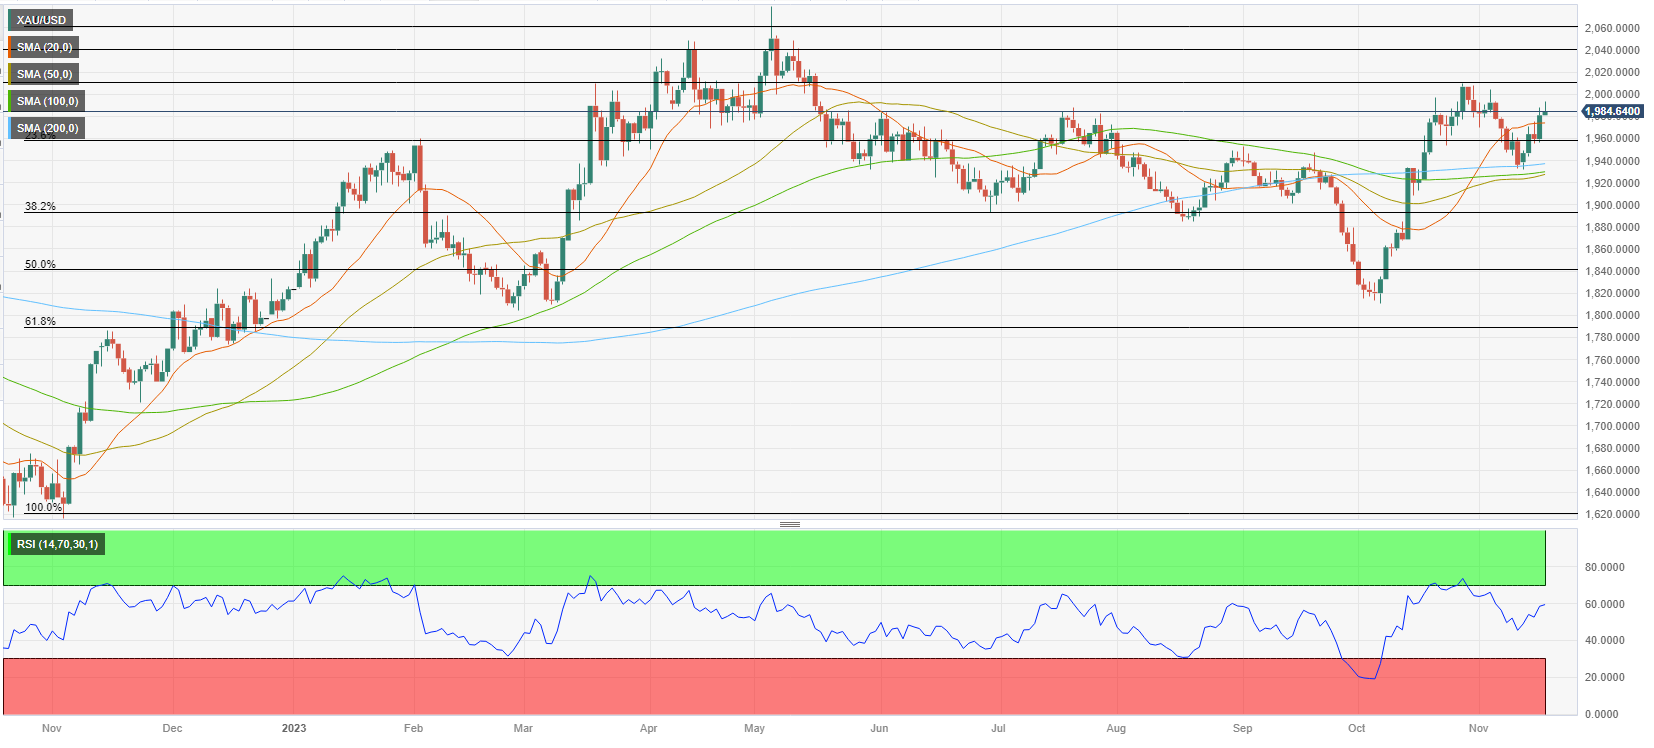
The Relative Strength Index (RSI) indicator on the daily chart climbed to 60, pointing to a buildup of bullish momentum in the near-term outlook. On the upside, $2,000 (psychological level, static level) aligns as immediate resistance before $2,010 (static level) and $2,040 (static level).
The 20-day Simple Moving Average (SMA) forms dynamic support at around $1,975 ahead of $1,960 (Fibonacci 38.2% retracement level of the latest uptrend). A daily close below the latter could attract sellers and open the door for an extended decline toward the $1,940-$1,930 area, where the 200-day, 100-day and the 50-day SMAs converge.
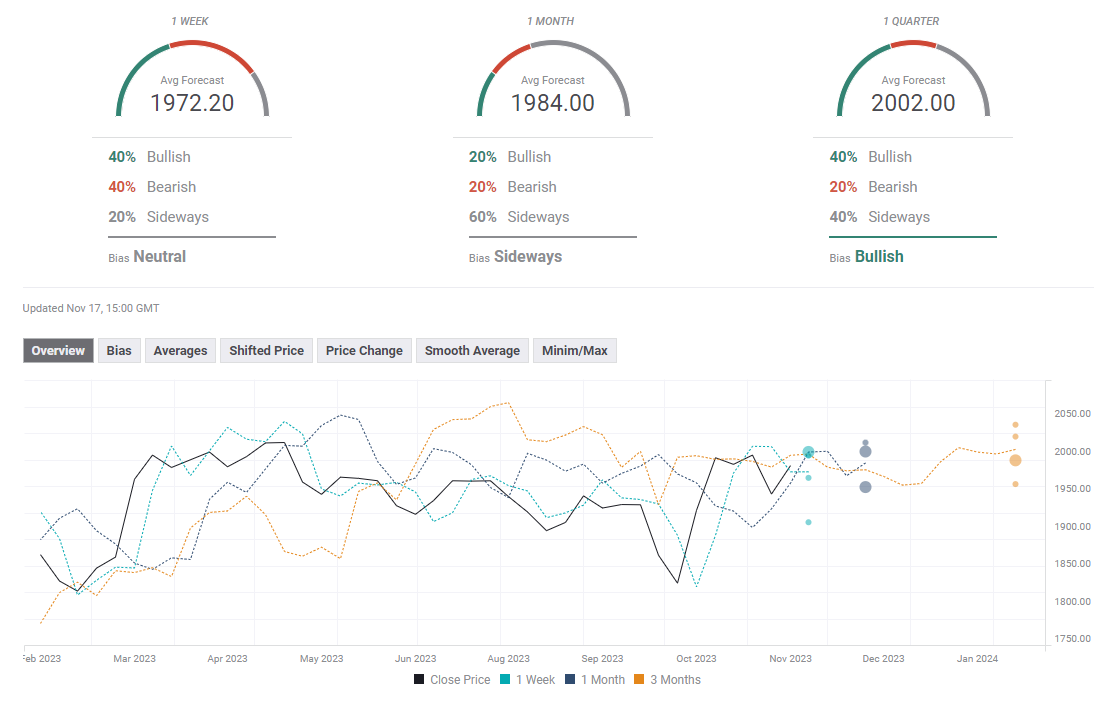
Gold forecast poll
[ad_2]
Source link